Screenplays & stories are made up of characters. There are a few stories where we can notice only one or two characters, however most stories employ between 2 and 20 characters, although we could find cases where there are more than 20 also.
A writer must ensure that relationships between characters are portrayed consistently across the entire screenplay. While it is possible that the relationships between characters shift from one to another, nevertheless we must maintain consistency in that also. For instance it is possible that a man and woman start off as friends, they may become lovers at the end of the screenplay. The meaning of their relationship may change over the course of the story. However, as a writer, one needs to be clear that the relationship between the characters from the very beginning.
Many writers use mind-maps, hand-drawn character relationship graphs or even just a lookup table to capture relationships between characters in their screenplays. In the next update of Scrite we are providing a formal way to capture relationships between characters. In the process of providing this functionality, Scrite also offers a more structured way for capturing information about characters themselves.
Capturing Meta Information About Characters
Let’s start by looking at how Scrite now allows writers to capture rich meta information about characters in the Notebook tab. In the screenshot below we have a screenplay opened on Scrite. It’s the same screenplay that Prashanth used for his demo at the SWA event conducted in the last week of August.
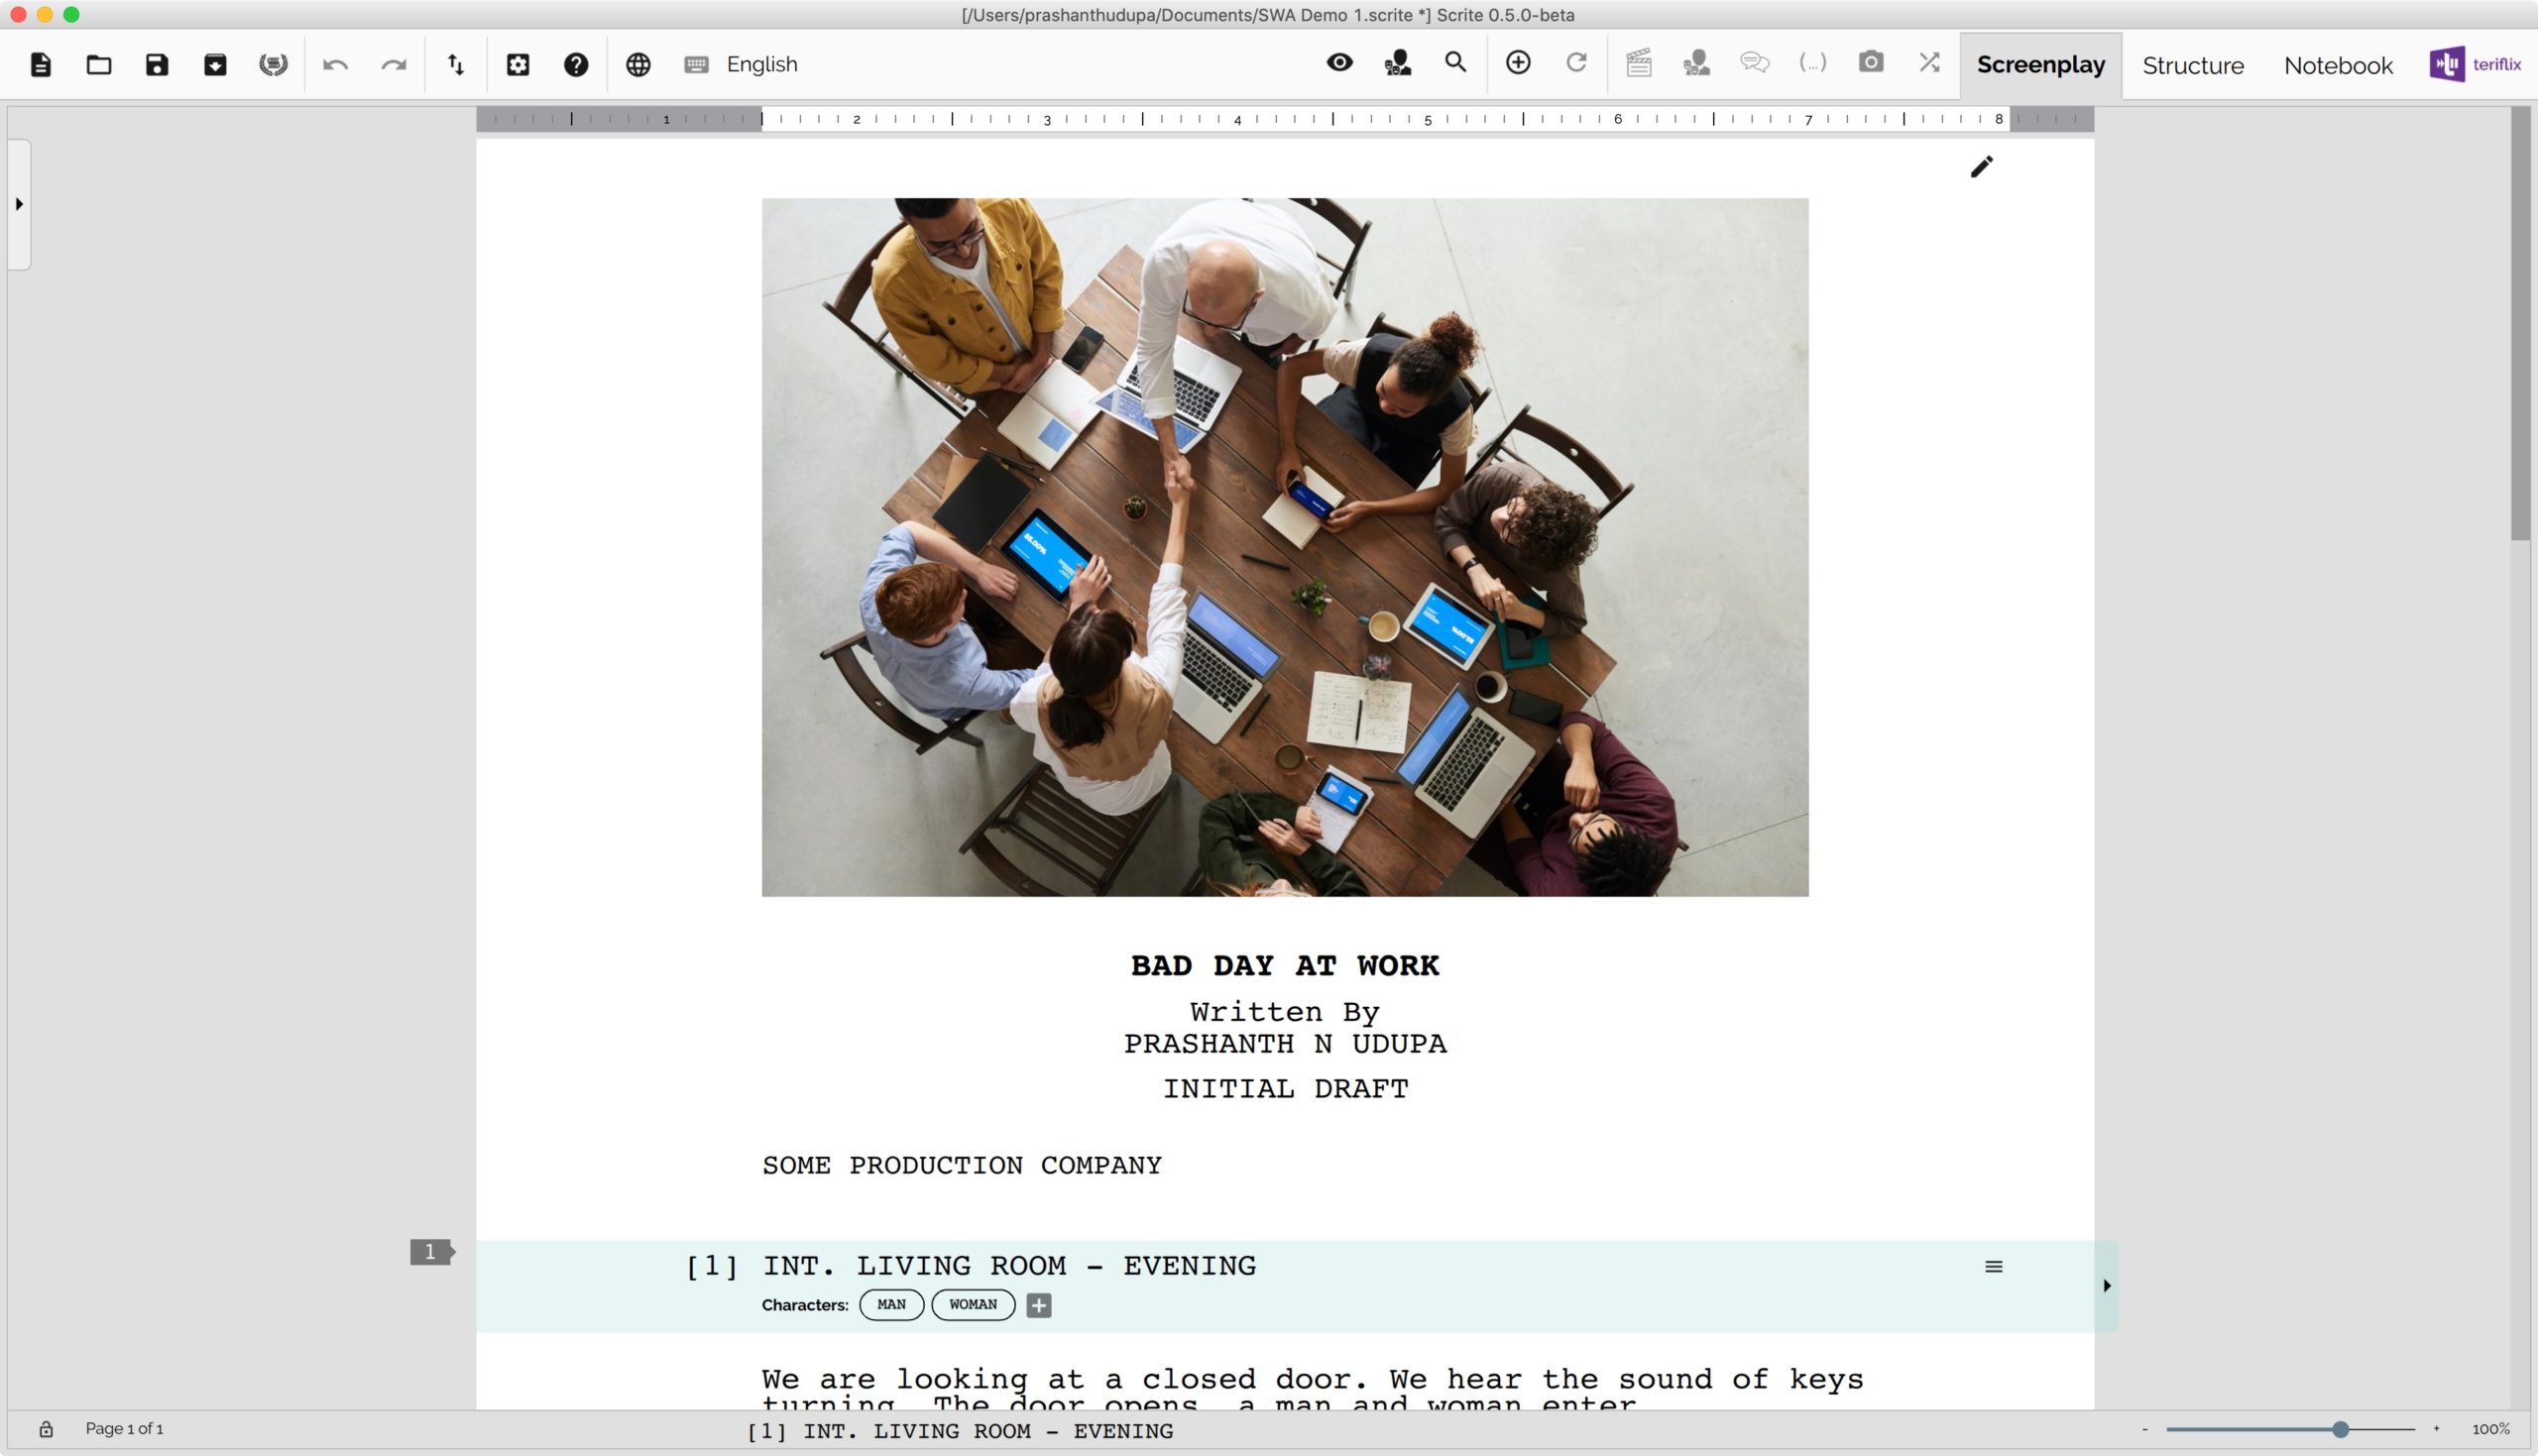
This screenplay has 4 scenes and 5 characters. Until 0.4.18, the only way to capture some meta information about characters in the screenplay was to tag notes against them in the notebook tab.
With 0.5.0 Beta, you can now do more than just capture notes. Lets see how.
When we switch the notebook tab in 0.5.0 Beta, you will notice that the story tab and scene tabs now have two child tabs in them. One for relationships and another for notes.
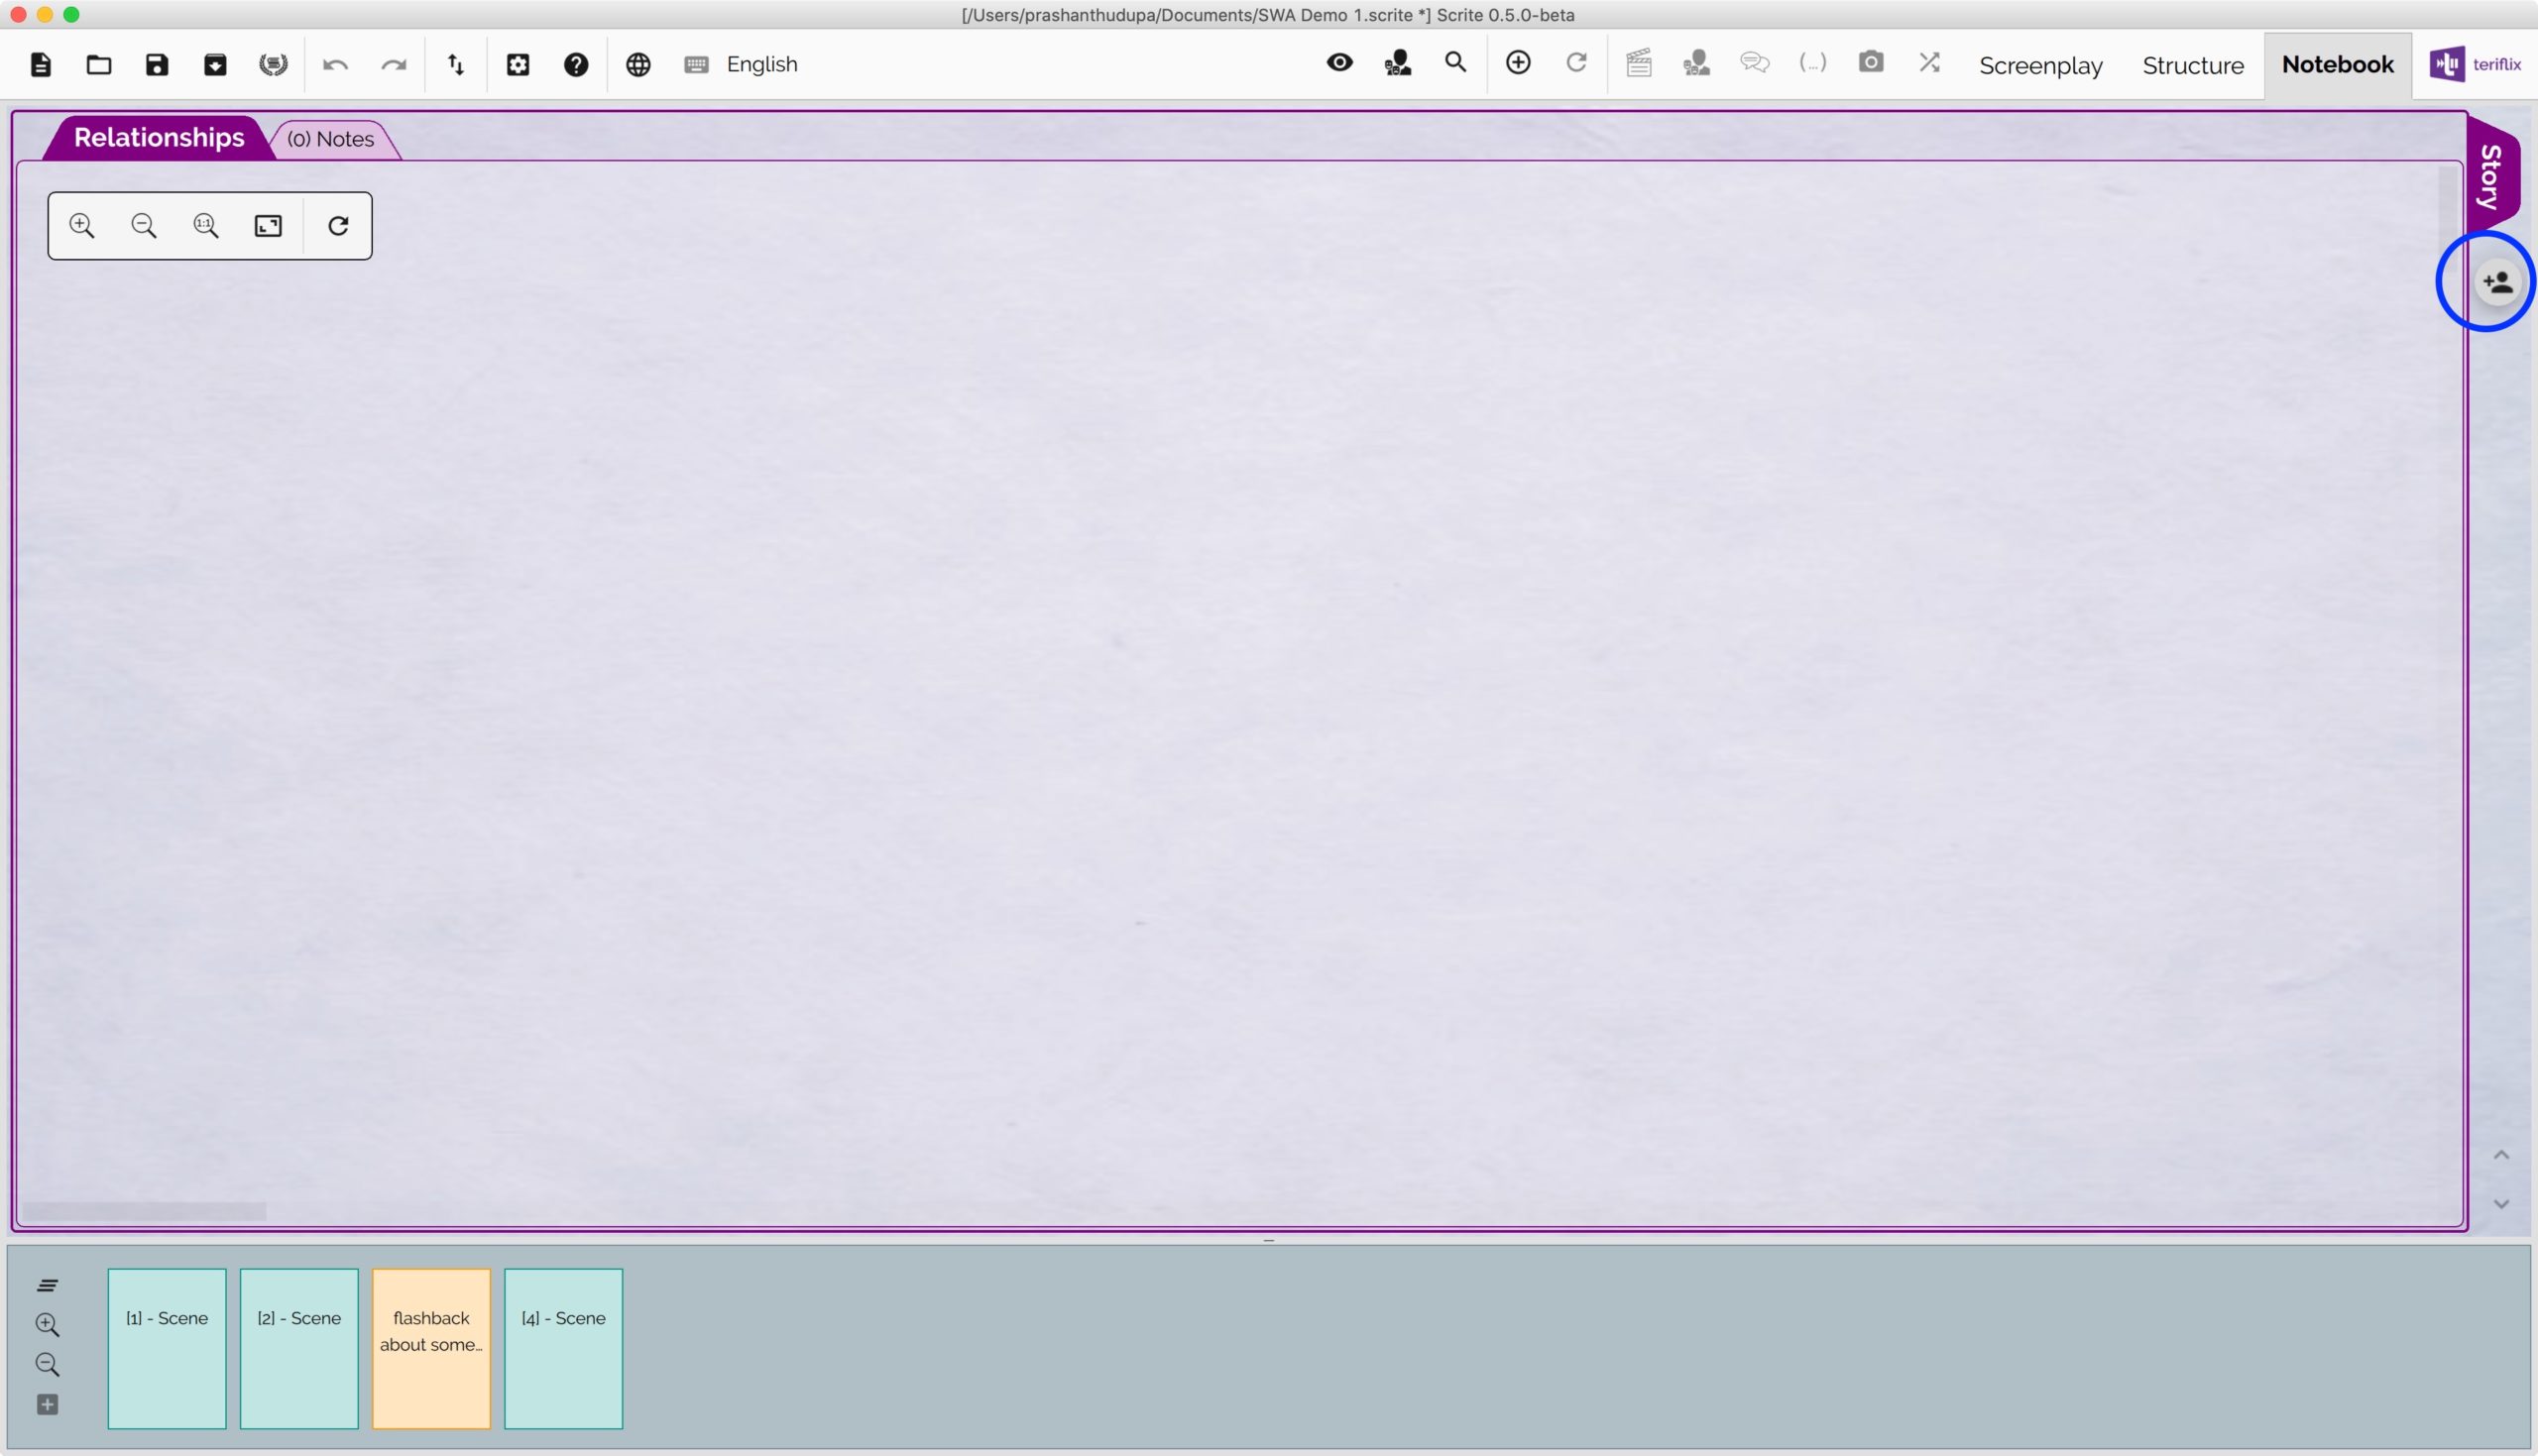
- The Relationships tab is where we can see a visual graph of relationships between various characters in the screenplay.
- The Notes tab is where we can capture notes as we used to do before.
- The button on the extreme right is used for adding tabs for characters in the notebook. When we click on that button, we get a dialog box where we can check all the characters for which we want a tab in the notebook
Lets go ahead and create sections in the Notebook for characters in the screenplay.
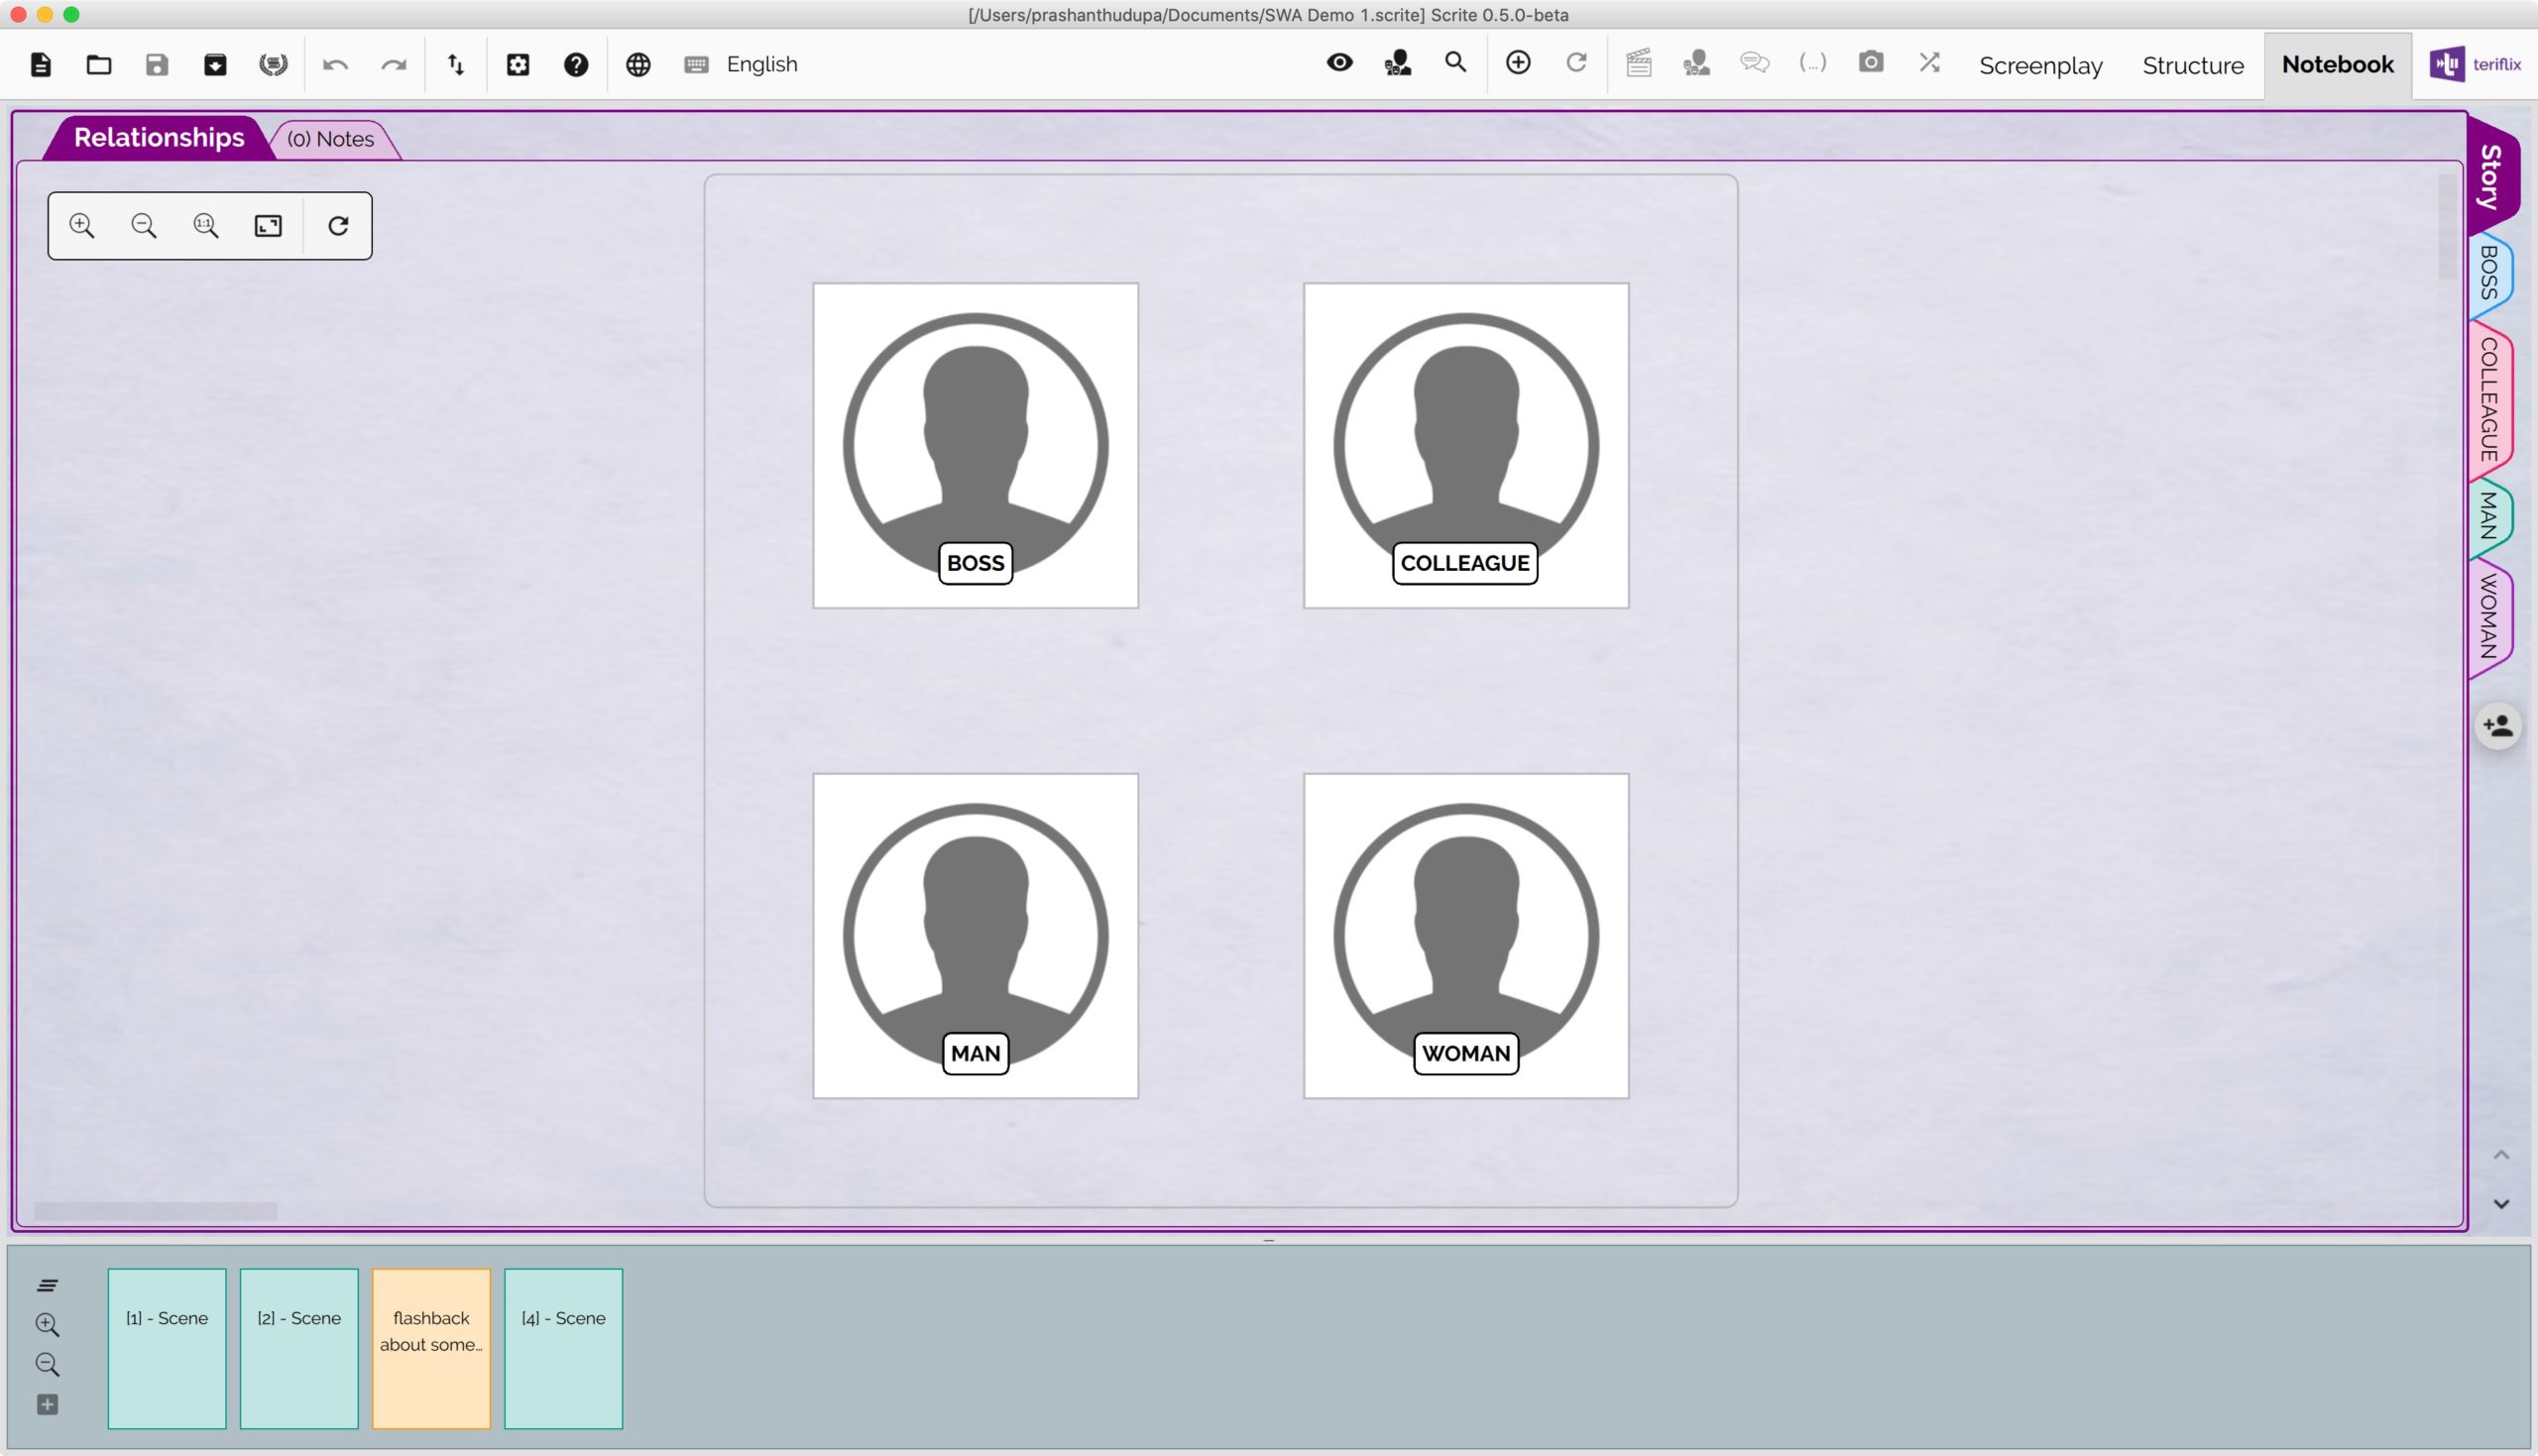
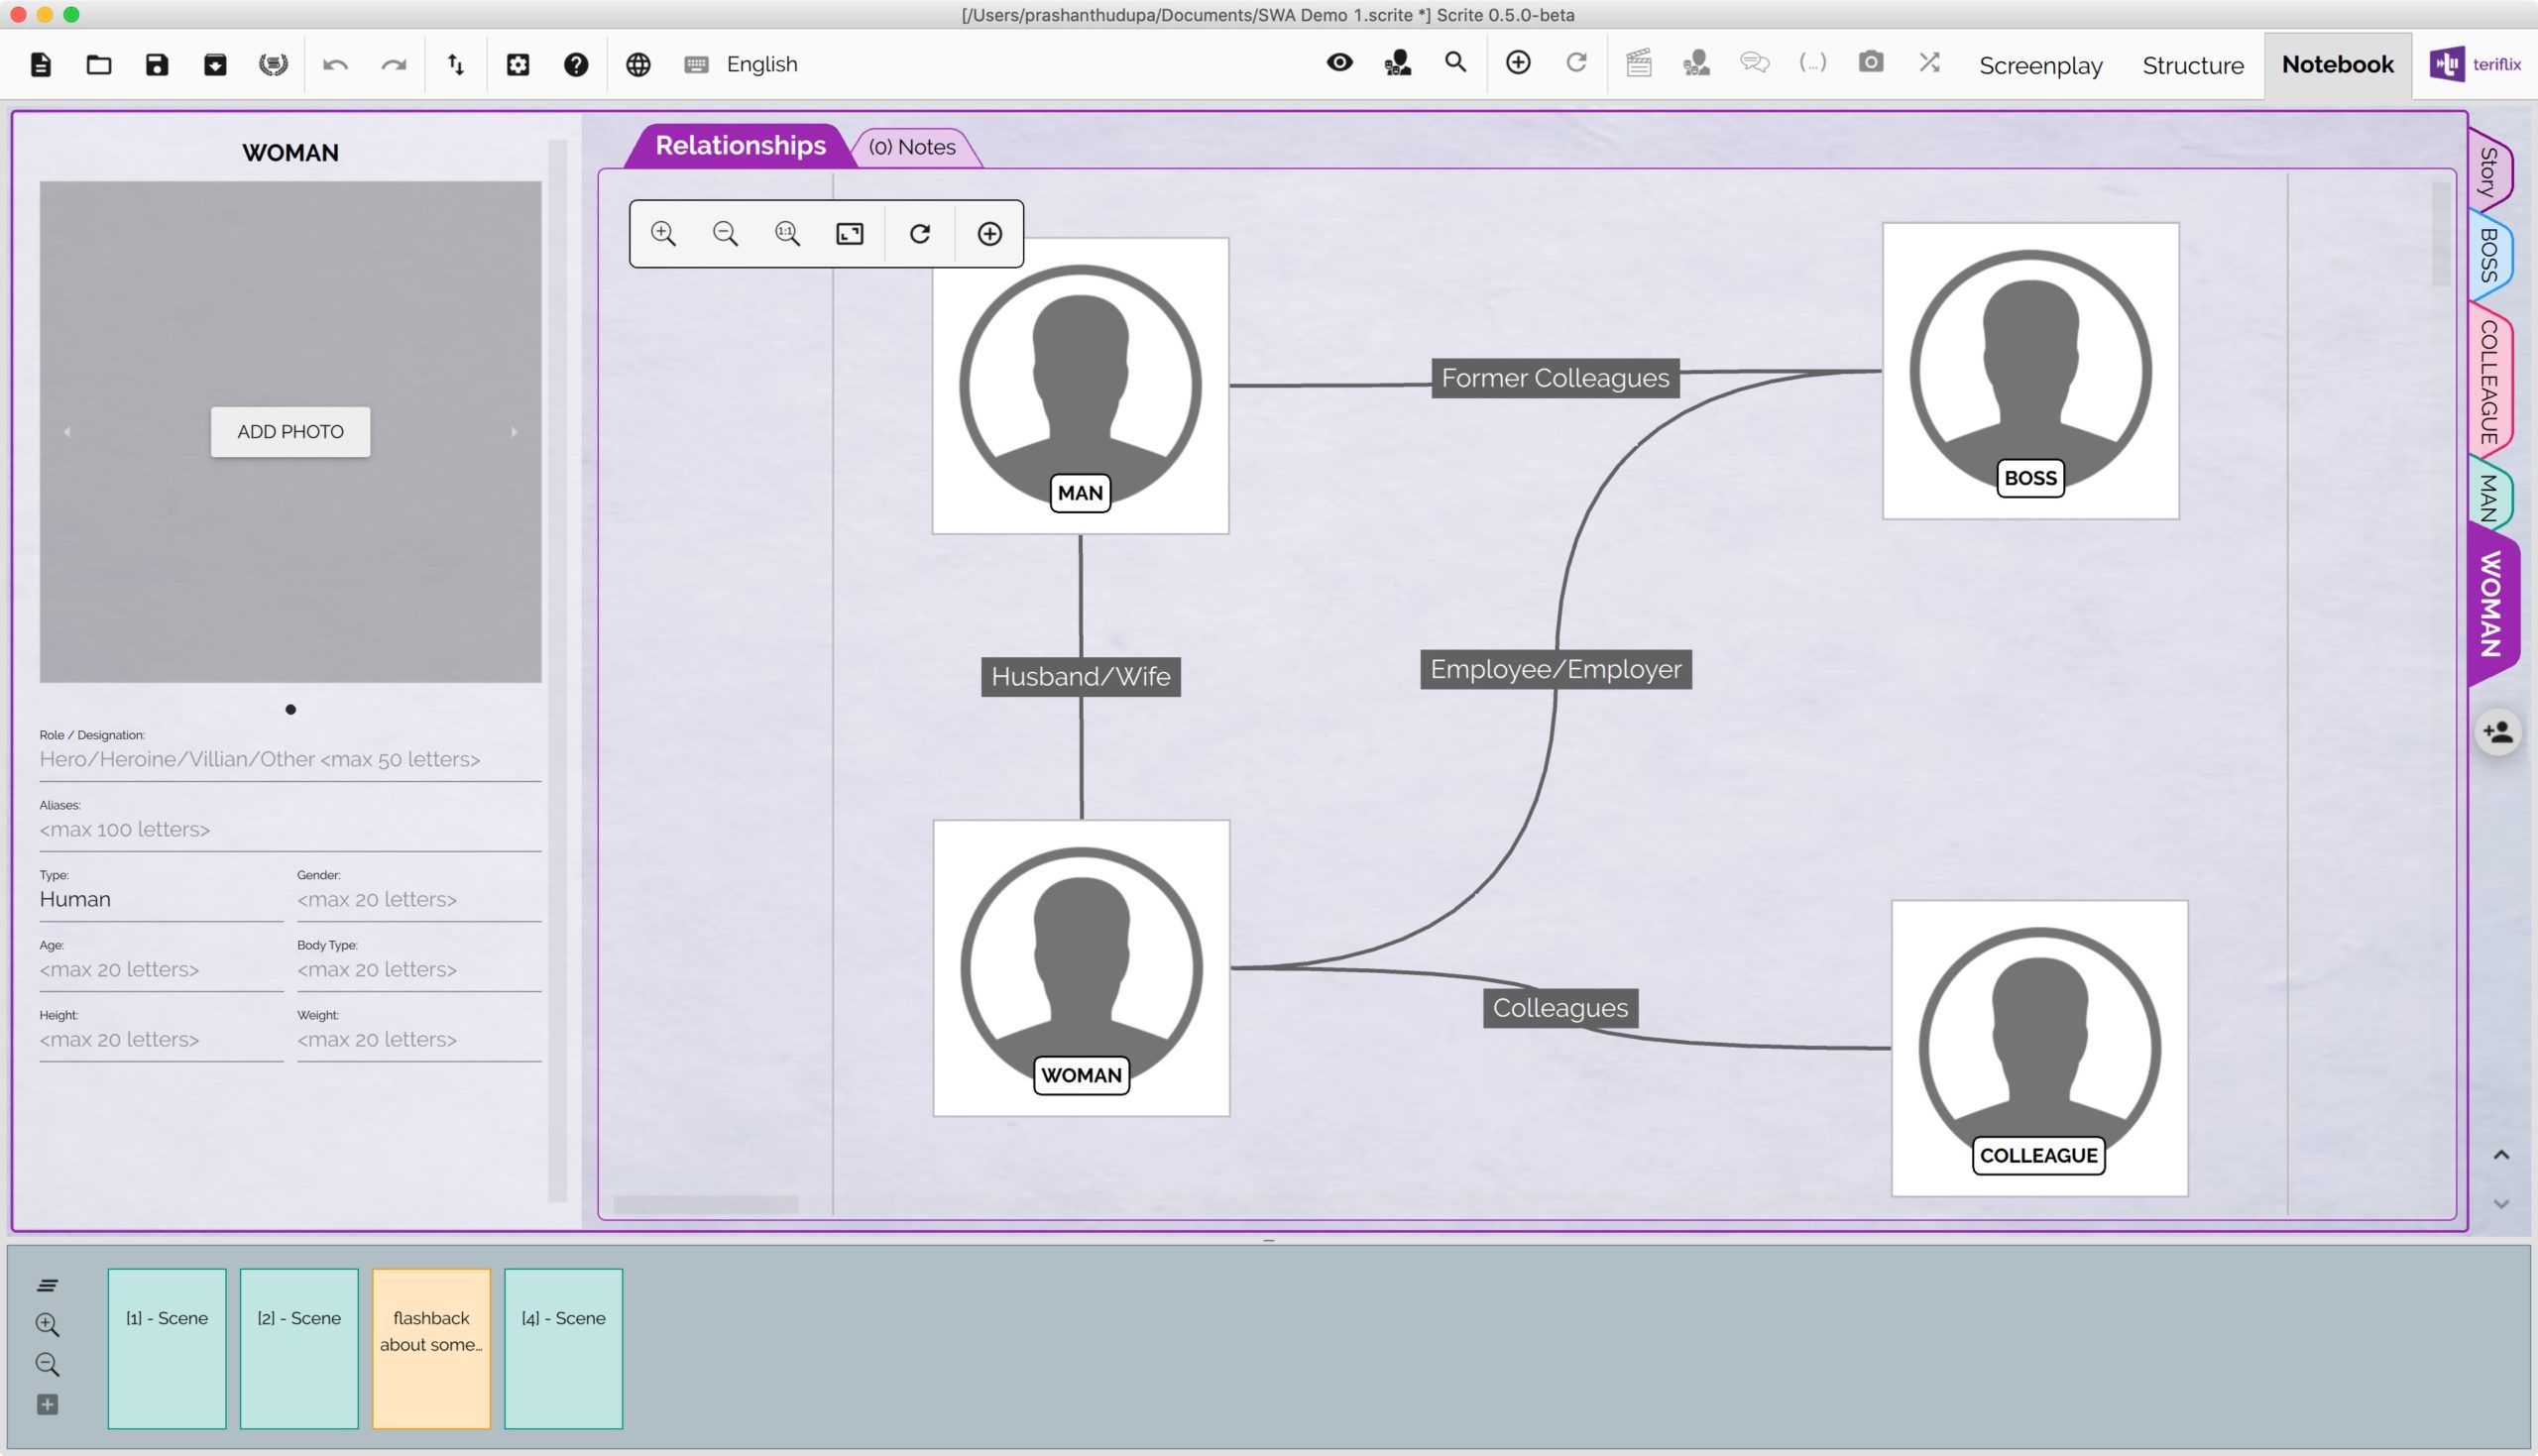
You will notice that the Story tab in the notebook shows a relationship graph, with all the four characters neatly placed in a grid.
You can double click on any of the characters in the graph or click on a character’s tab on the right to switch to the page where relationships and notes for a specific character can be captured. Lets switch to the MAN‘s tab on Notebook.
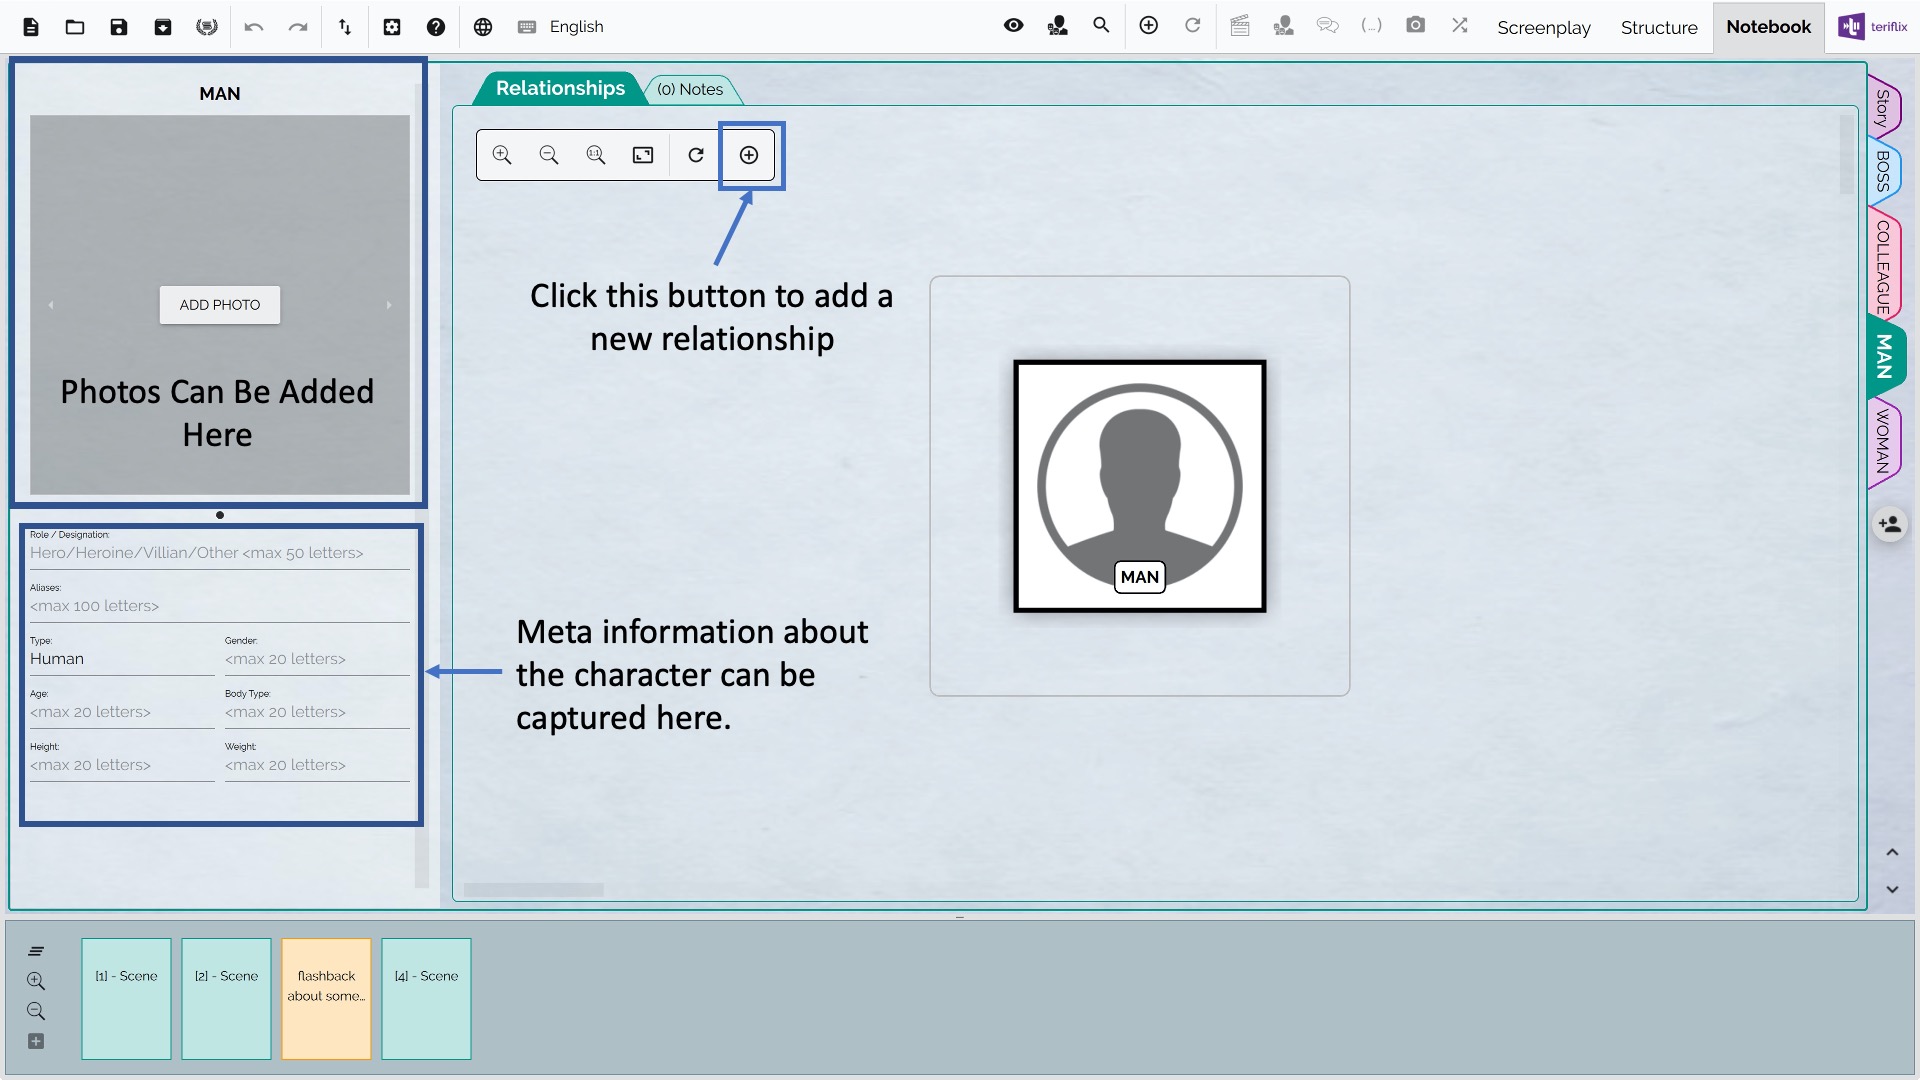
Most writers introduce their characters in their screenplay in terms of their age, height, weight, body type etc. We can now formally capture that in the character notes page. We can even add photos of the character. They need not be photos of the actor cast for the character, they could be photo of anybody who the writer thinks looks like the character they are writing.
By clicking on the + button in the relationships panel, we can pull out a dialog box where we can name how the character in question is related to others in the screenplay.
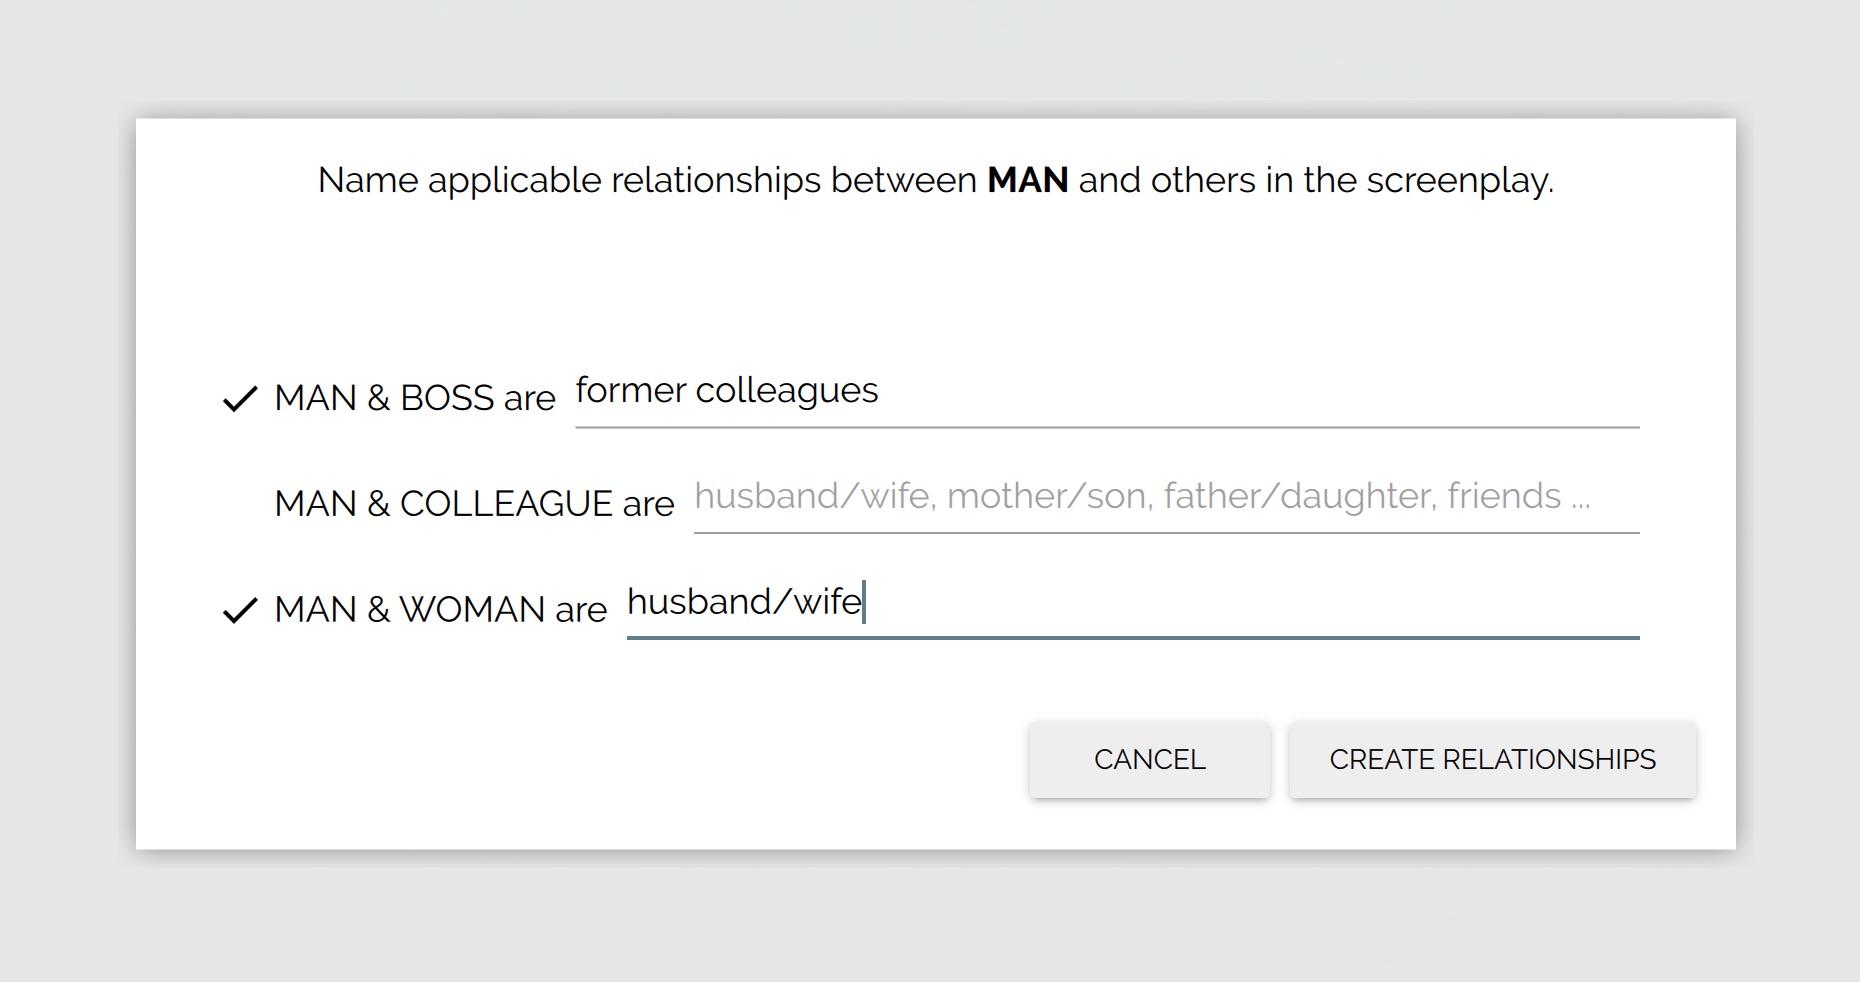
The relationship name is how we would say the character in question is related to the other character. In this case the MAN is a former colleague of whoever we portray as BOSS in the screenplay. When we click on the “Create Relationships” button, Scrite not only lists the newly created relationships in the panel, it will also create new tabs for characters who did not have tabs before.
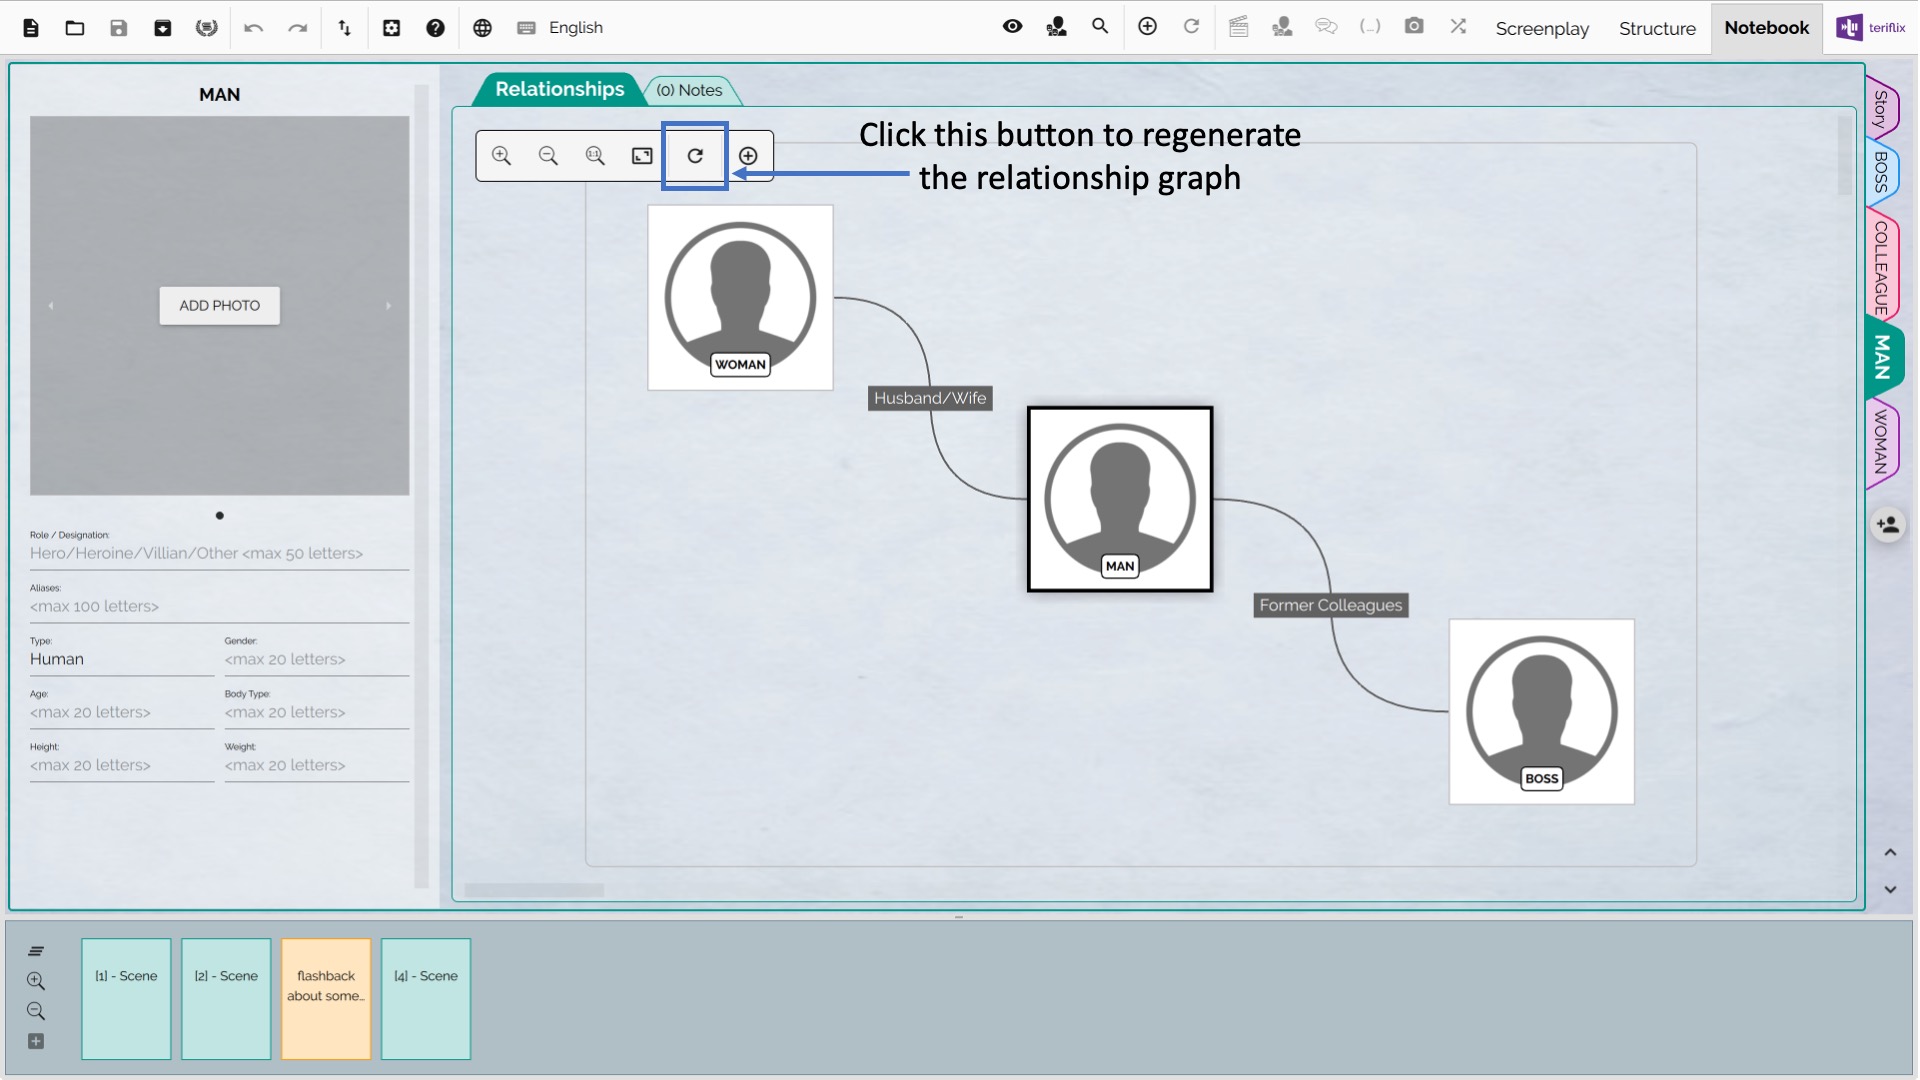
This graph is automatically constructed by leveraging the “Force Directed Graph” (FDG) algorithm. While the automatically constructed graph works best in most cases, it is possible to explicitly move characters around. We may not find any need for this in simple graphs like this, but for large complex relationship graphs it may be useful to do so.
We can switch to the tab of the WOMAN character for example, by double clicking on the node icon for WOMAN in the graph.
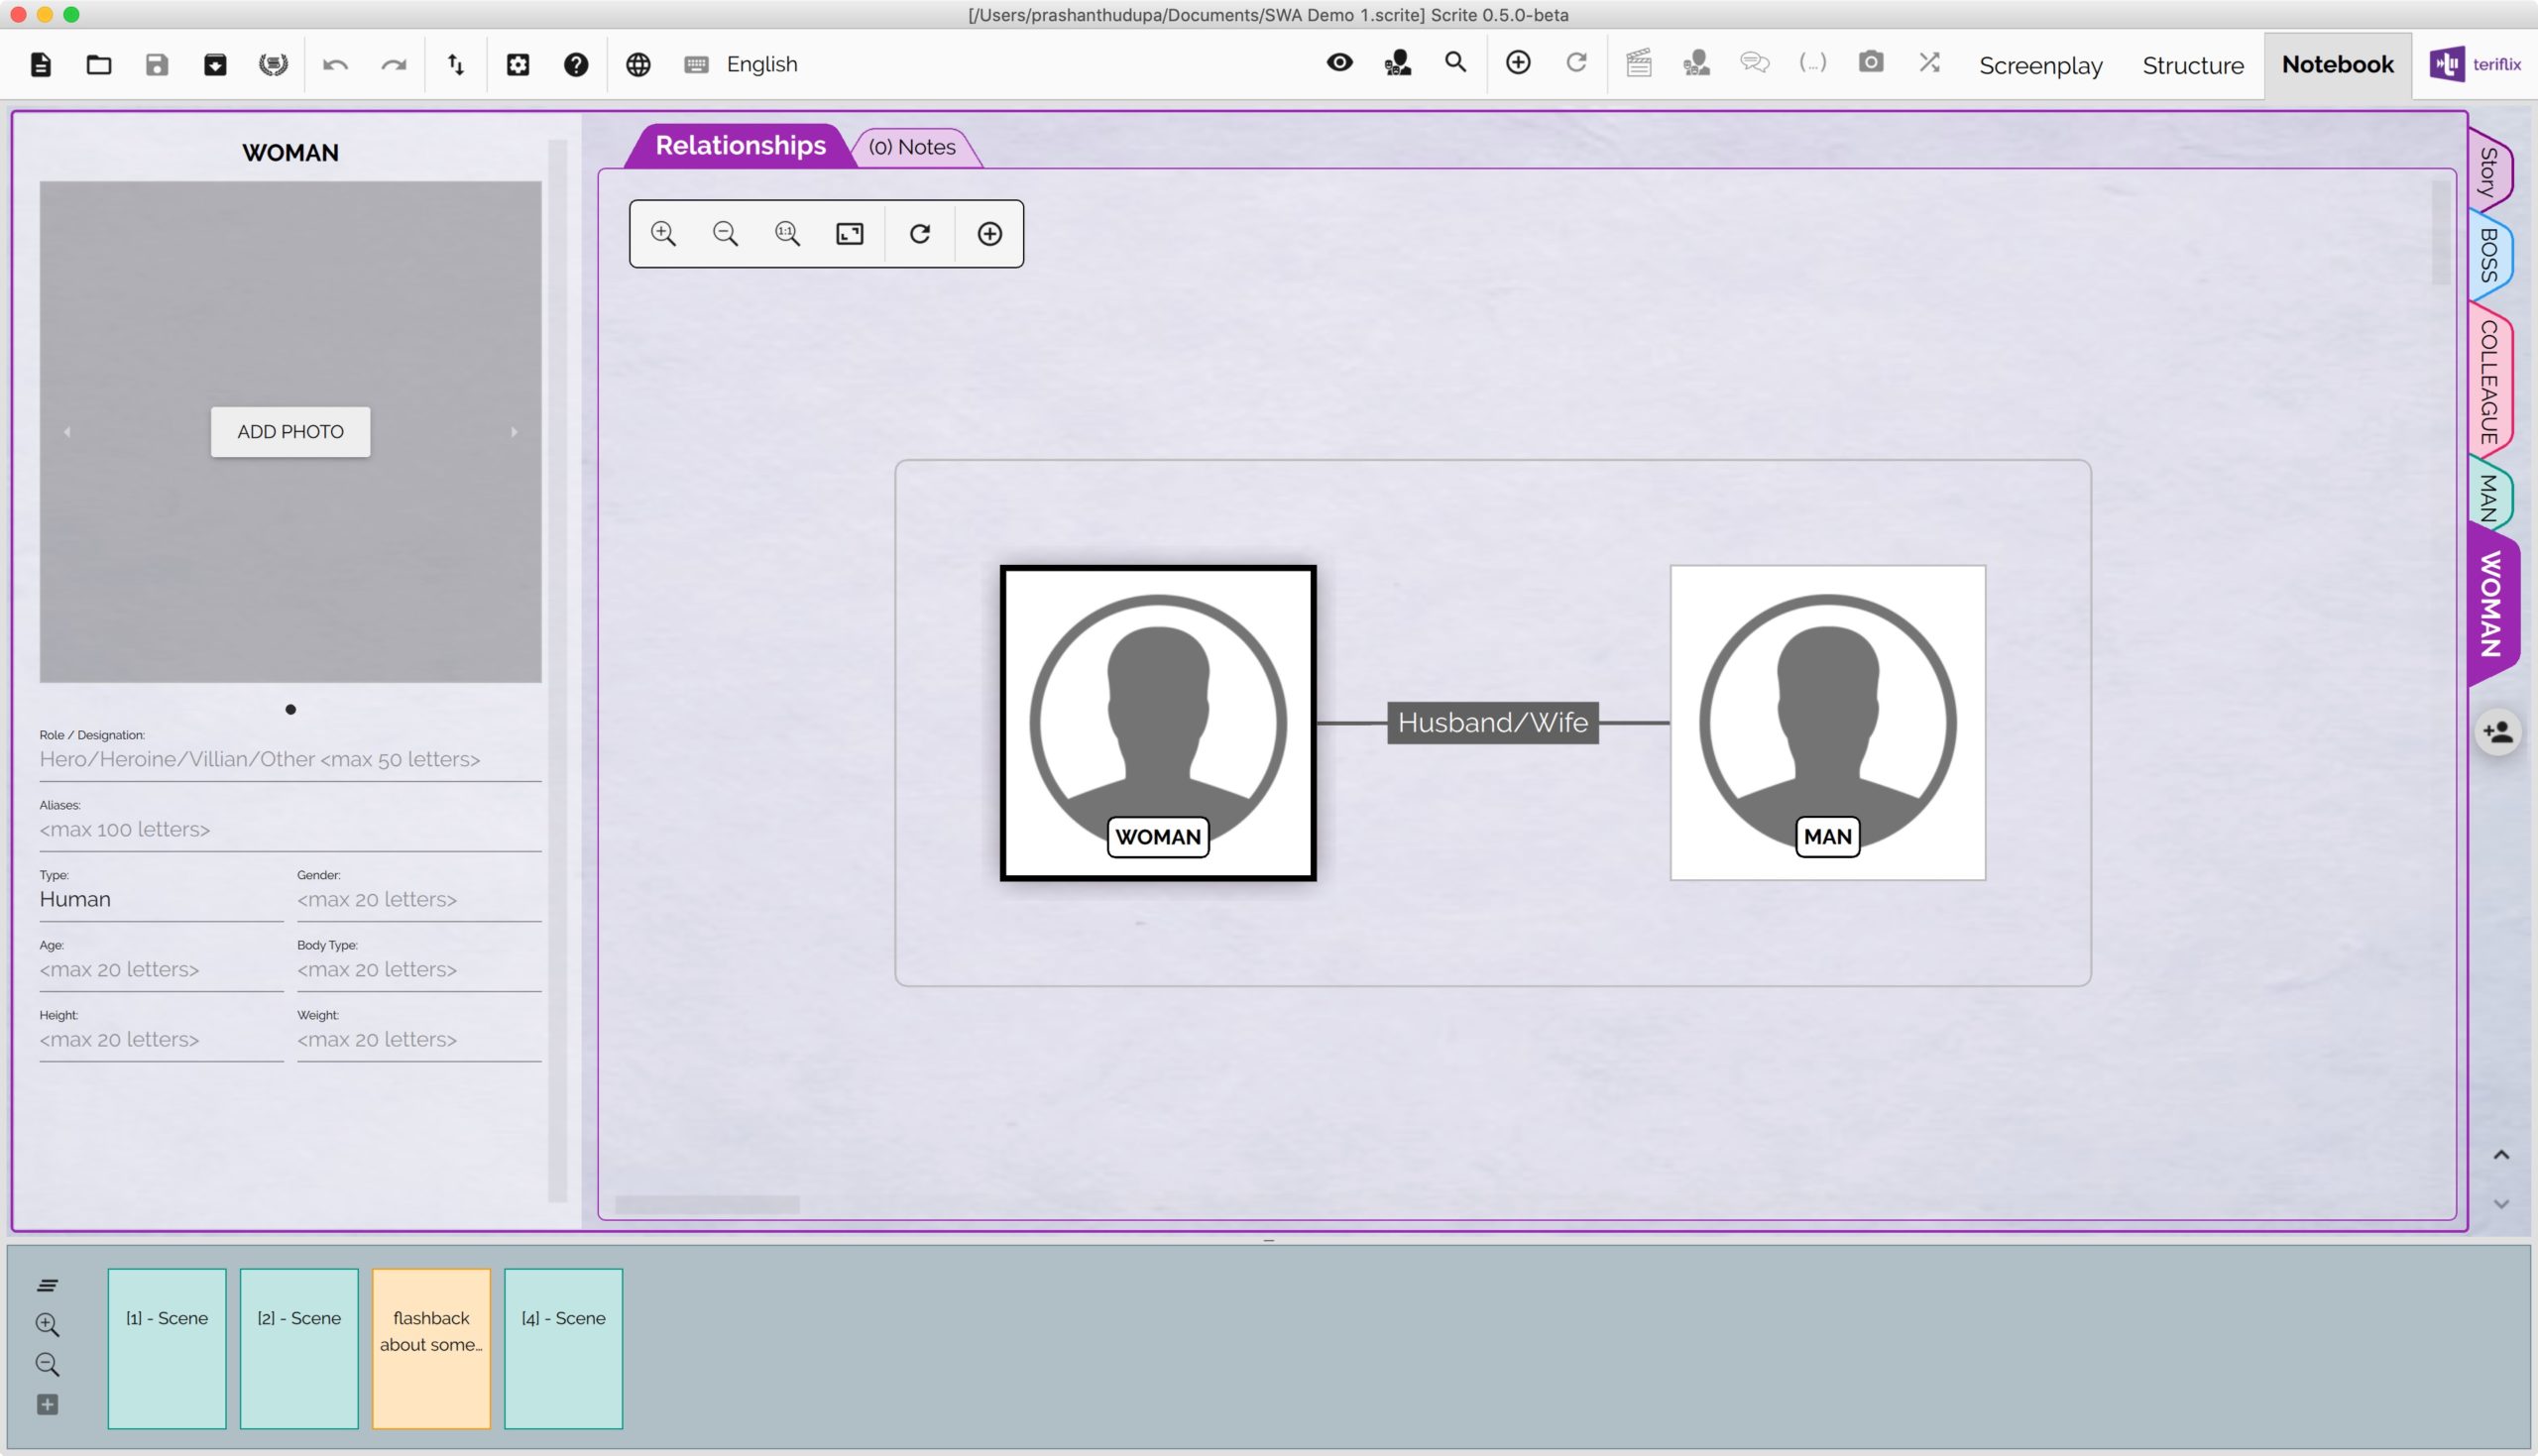
The relationship graph shown in the character tab on the notebook shows only those relationships that are directly connected to the character in question.
Since the relationship between MAN and WOMAN was already captured in the MAN’s tab, we see it here already. We can now go ahead and create new relationships for the WOMAN.
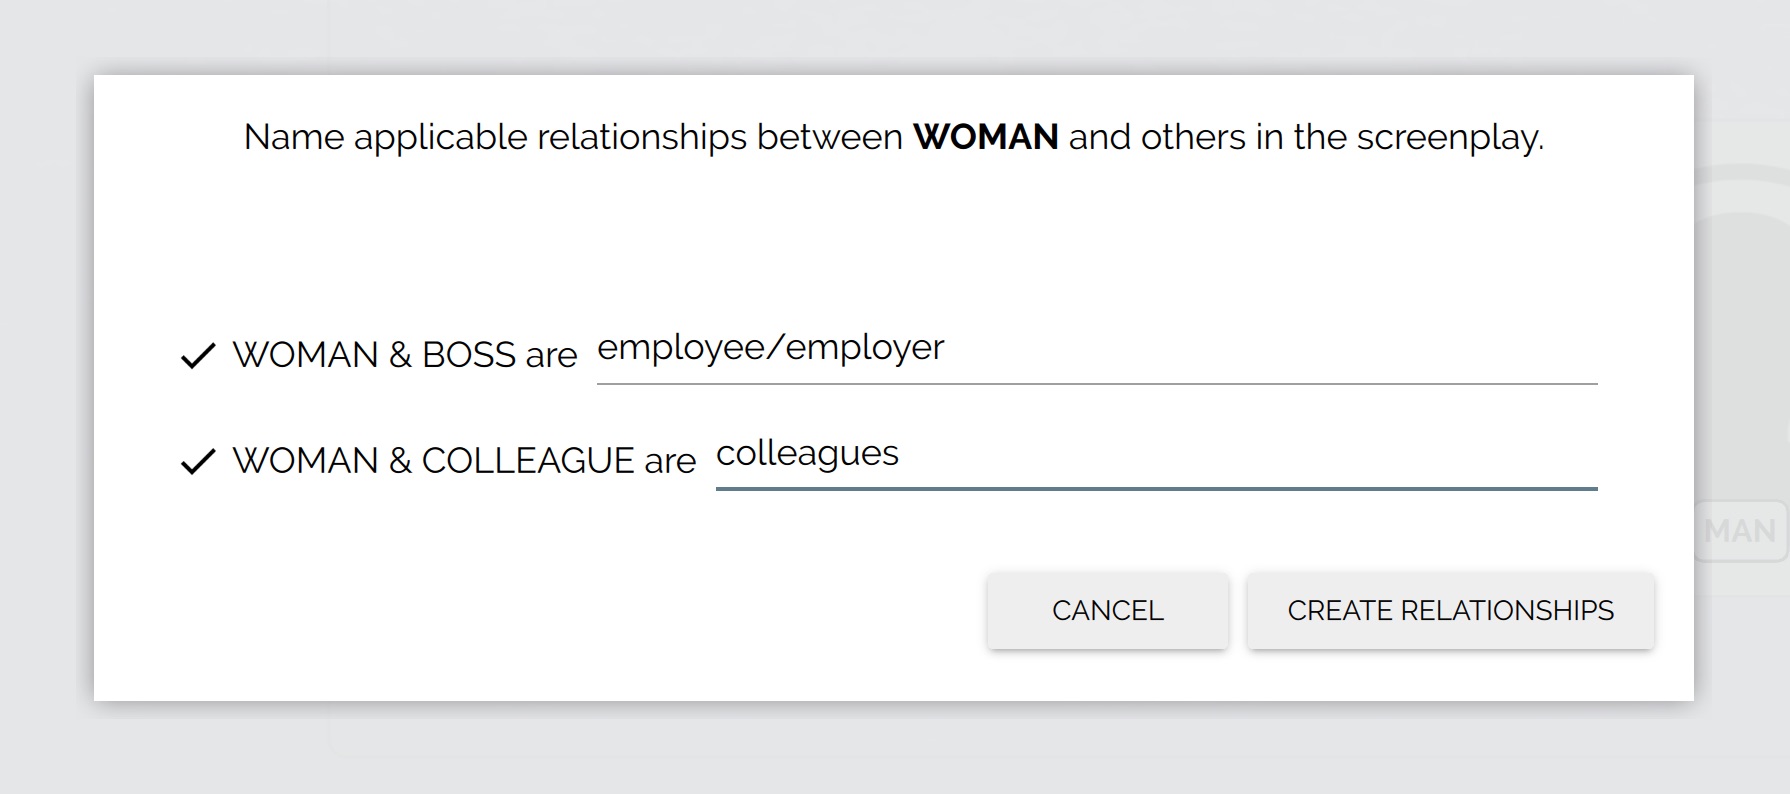
Scrite regenerates the relationship graph. If you are not happy with the way the characters are placed on the graph, you can drag and move them around.
The Story tab also has a relationship graph, but that one shows relationships between all characters for whom a tab is created in Notebook.
When a specific scene is clicked on, a new tab just for that scene is created on the Notebook. Clicking on that tab shows relationships for only those characters that are present in the scene.
Character Relationship Graph Of Baahubali
Lets take a real world example and see how all this scales. Lets take Baahubali for example and consider the characters: Amarendra Baahubali, Mahendra Baahubali, Devasena, Sivagami, Bhallaldeva, Bhijjaladeva, Kumara Varma and Katappa. We have taken the liberty of assigning photos to each of these characters and capturing direct relationships between them.
Shown below is character notes tab for AMARENDRA BAAHUBALI.
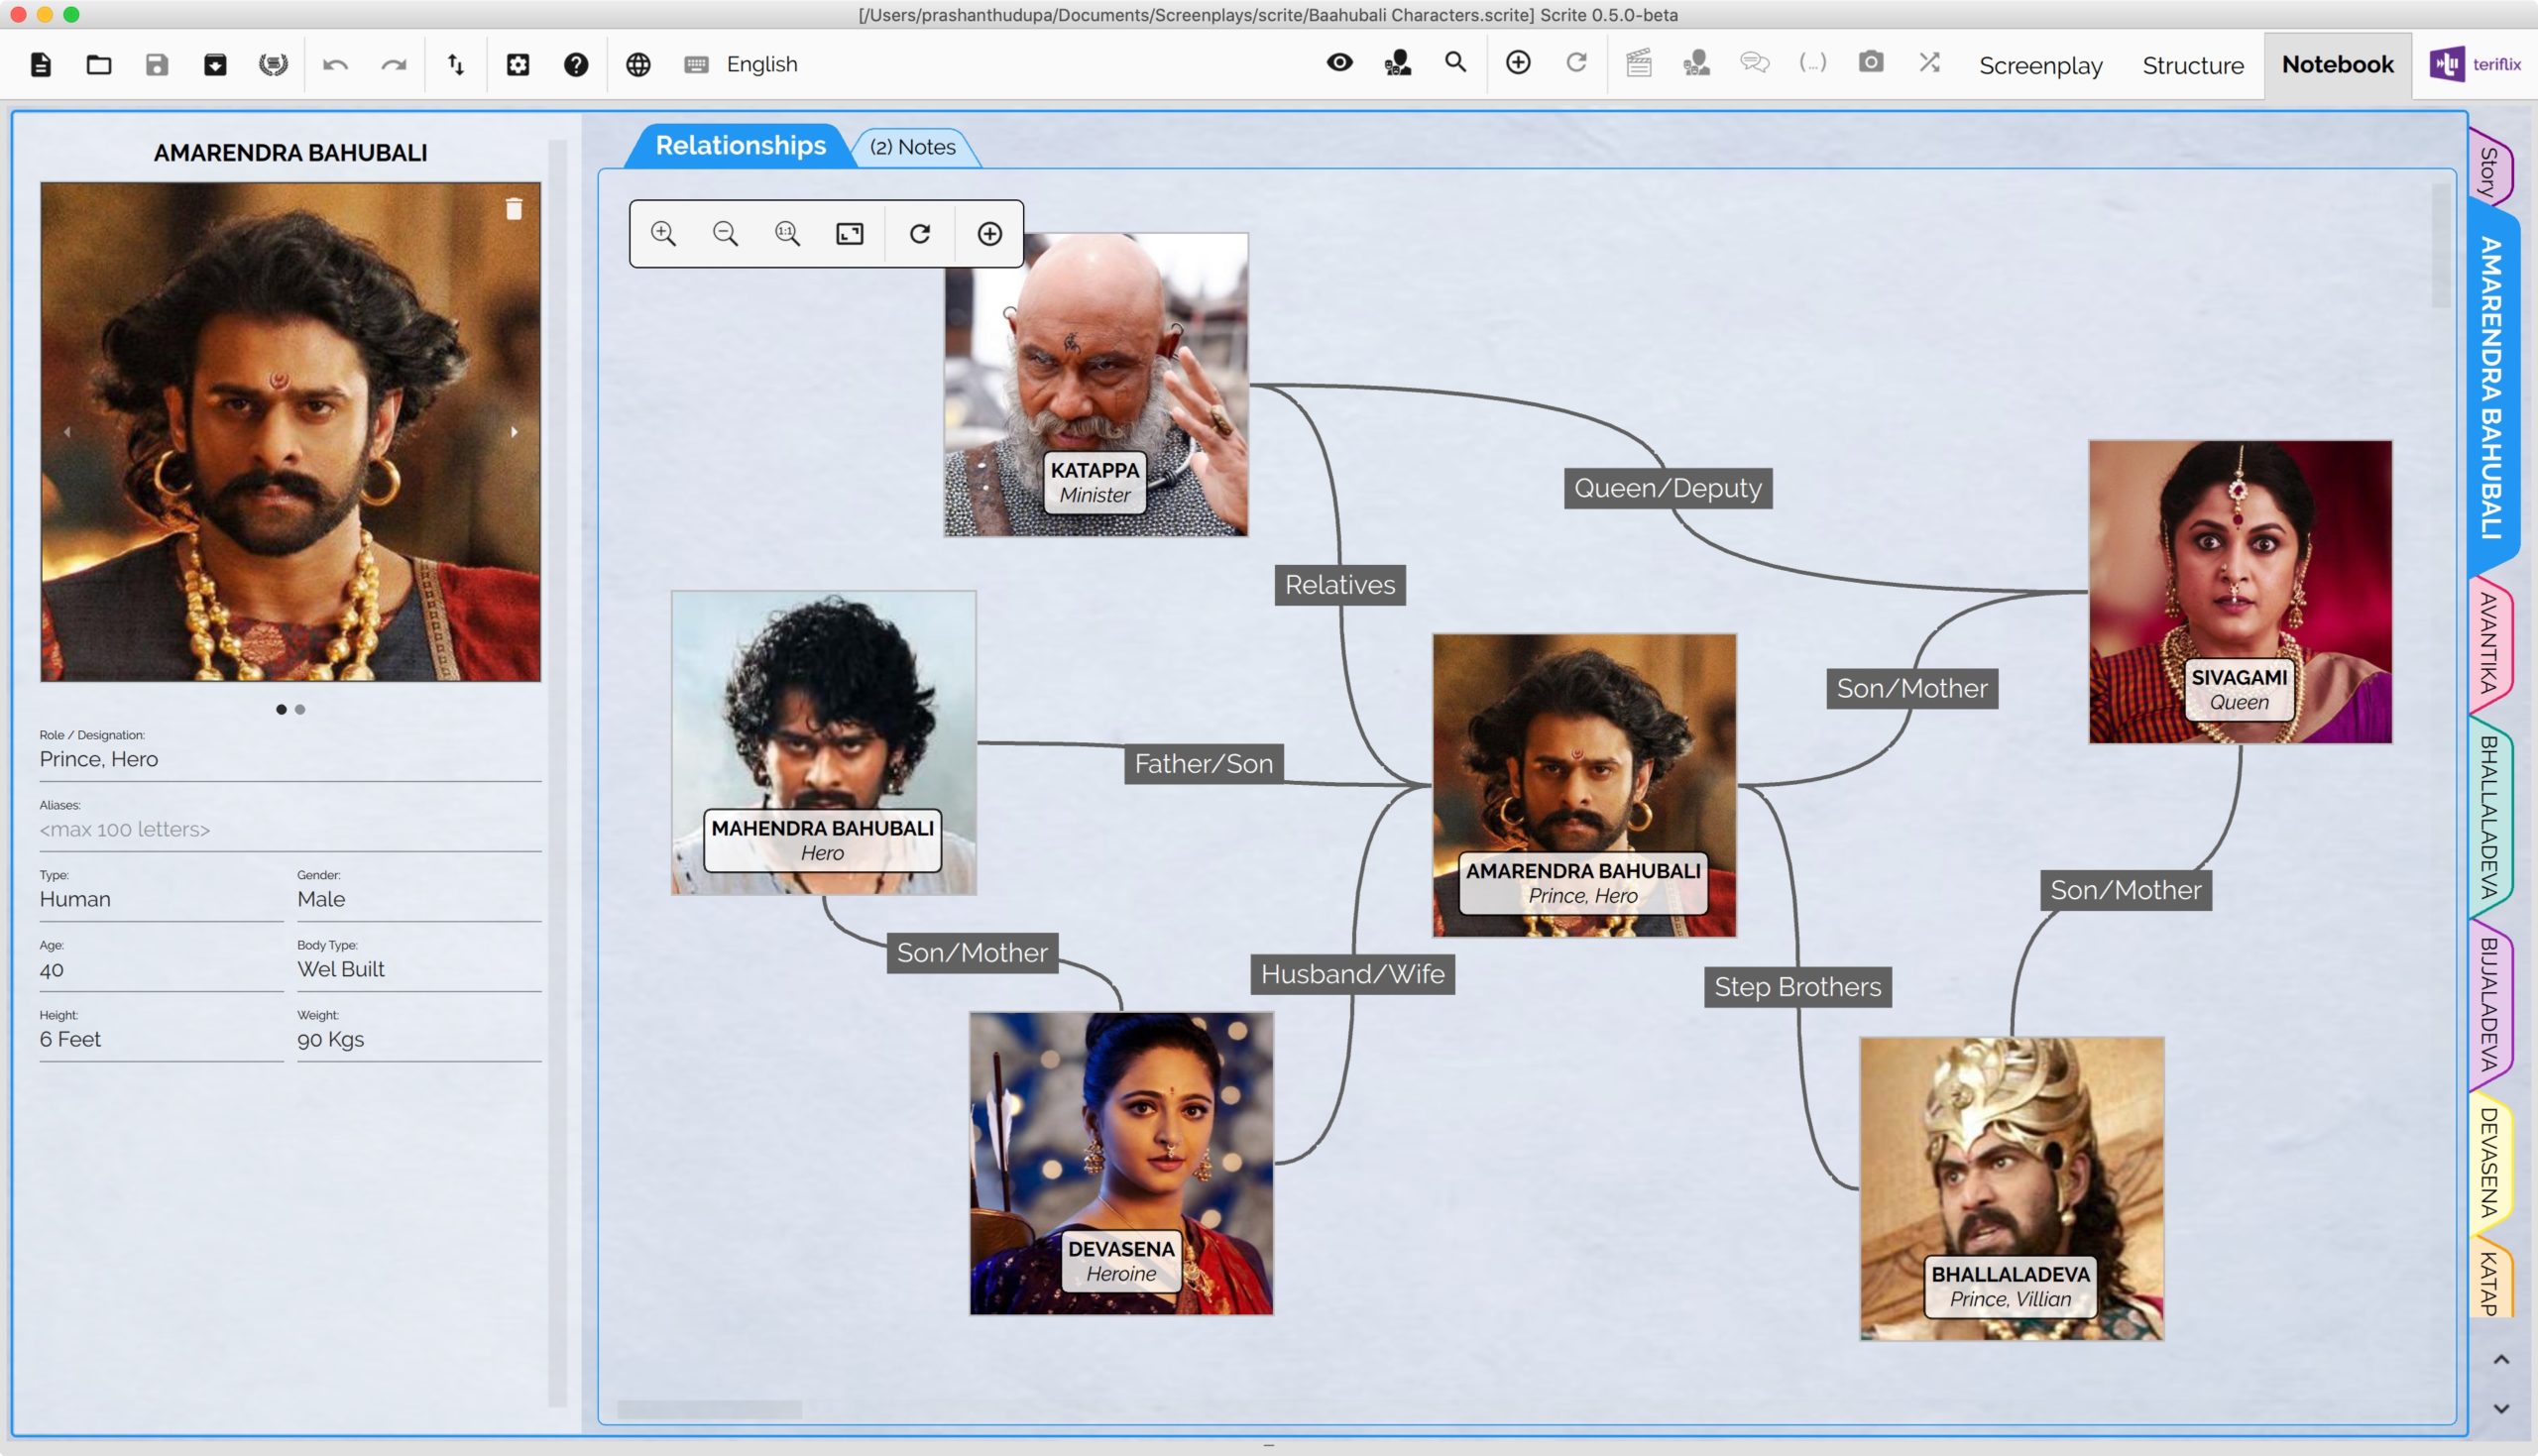
As you can see, only those characters directly related to AMARENDRA BAAHUBALI are shown in this graph. Relationships of DEVASENA, for example, are not shown, unless they are between other characters who are also related to AMARENDRA BAAHUBALI.
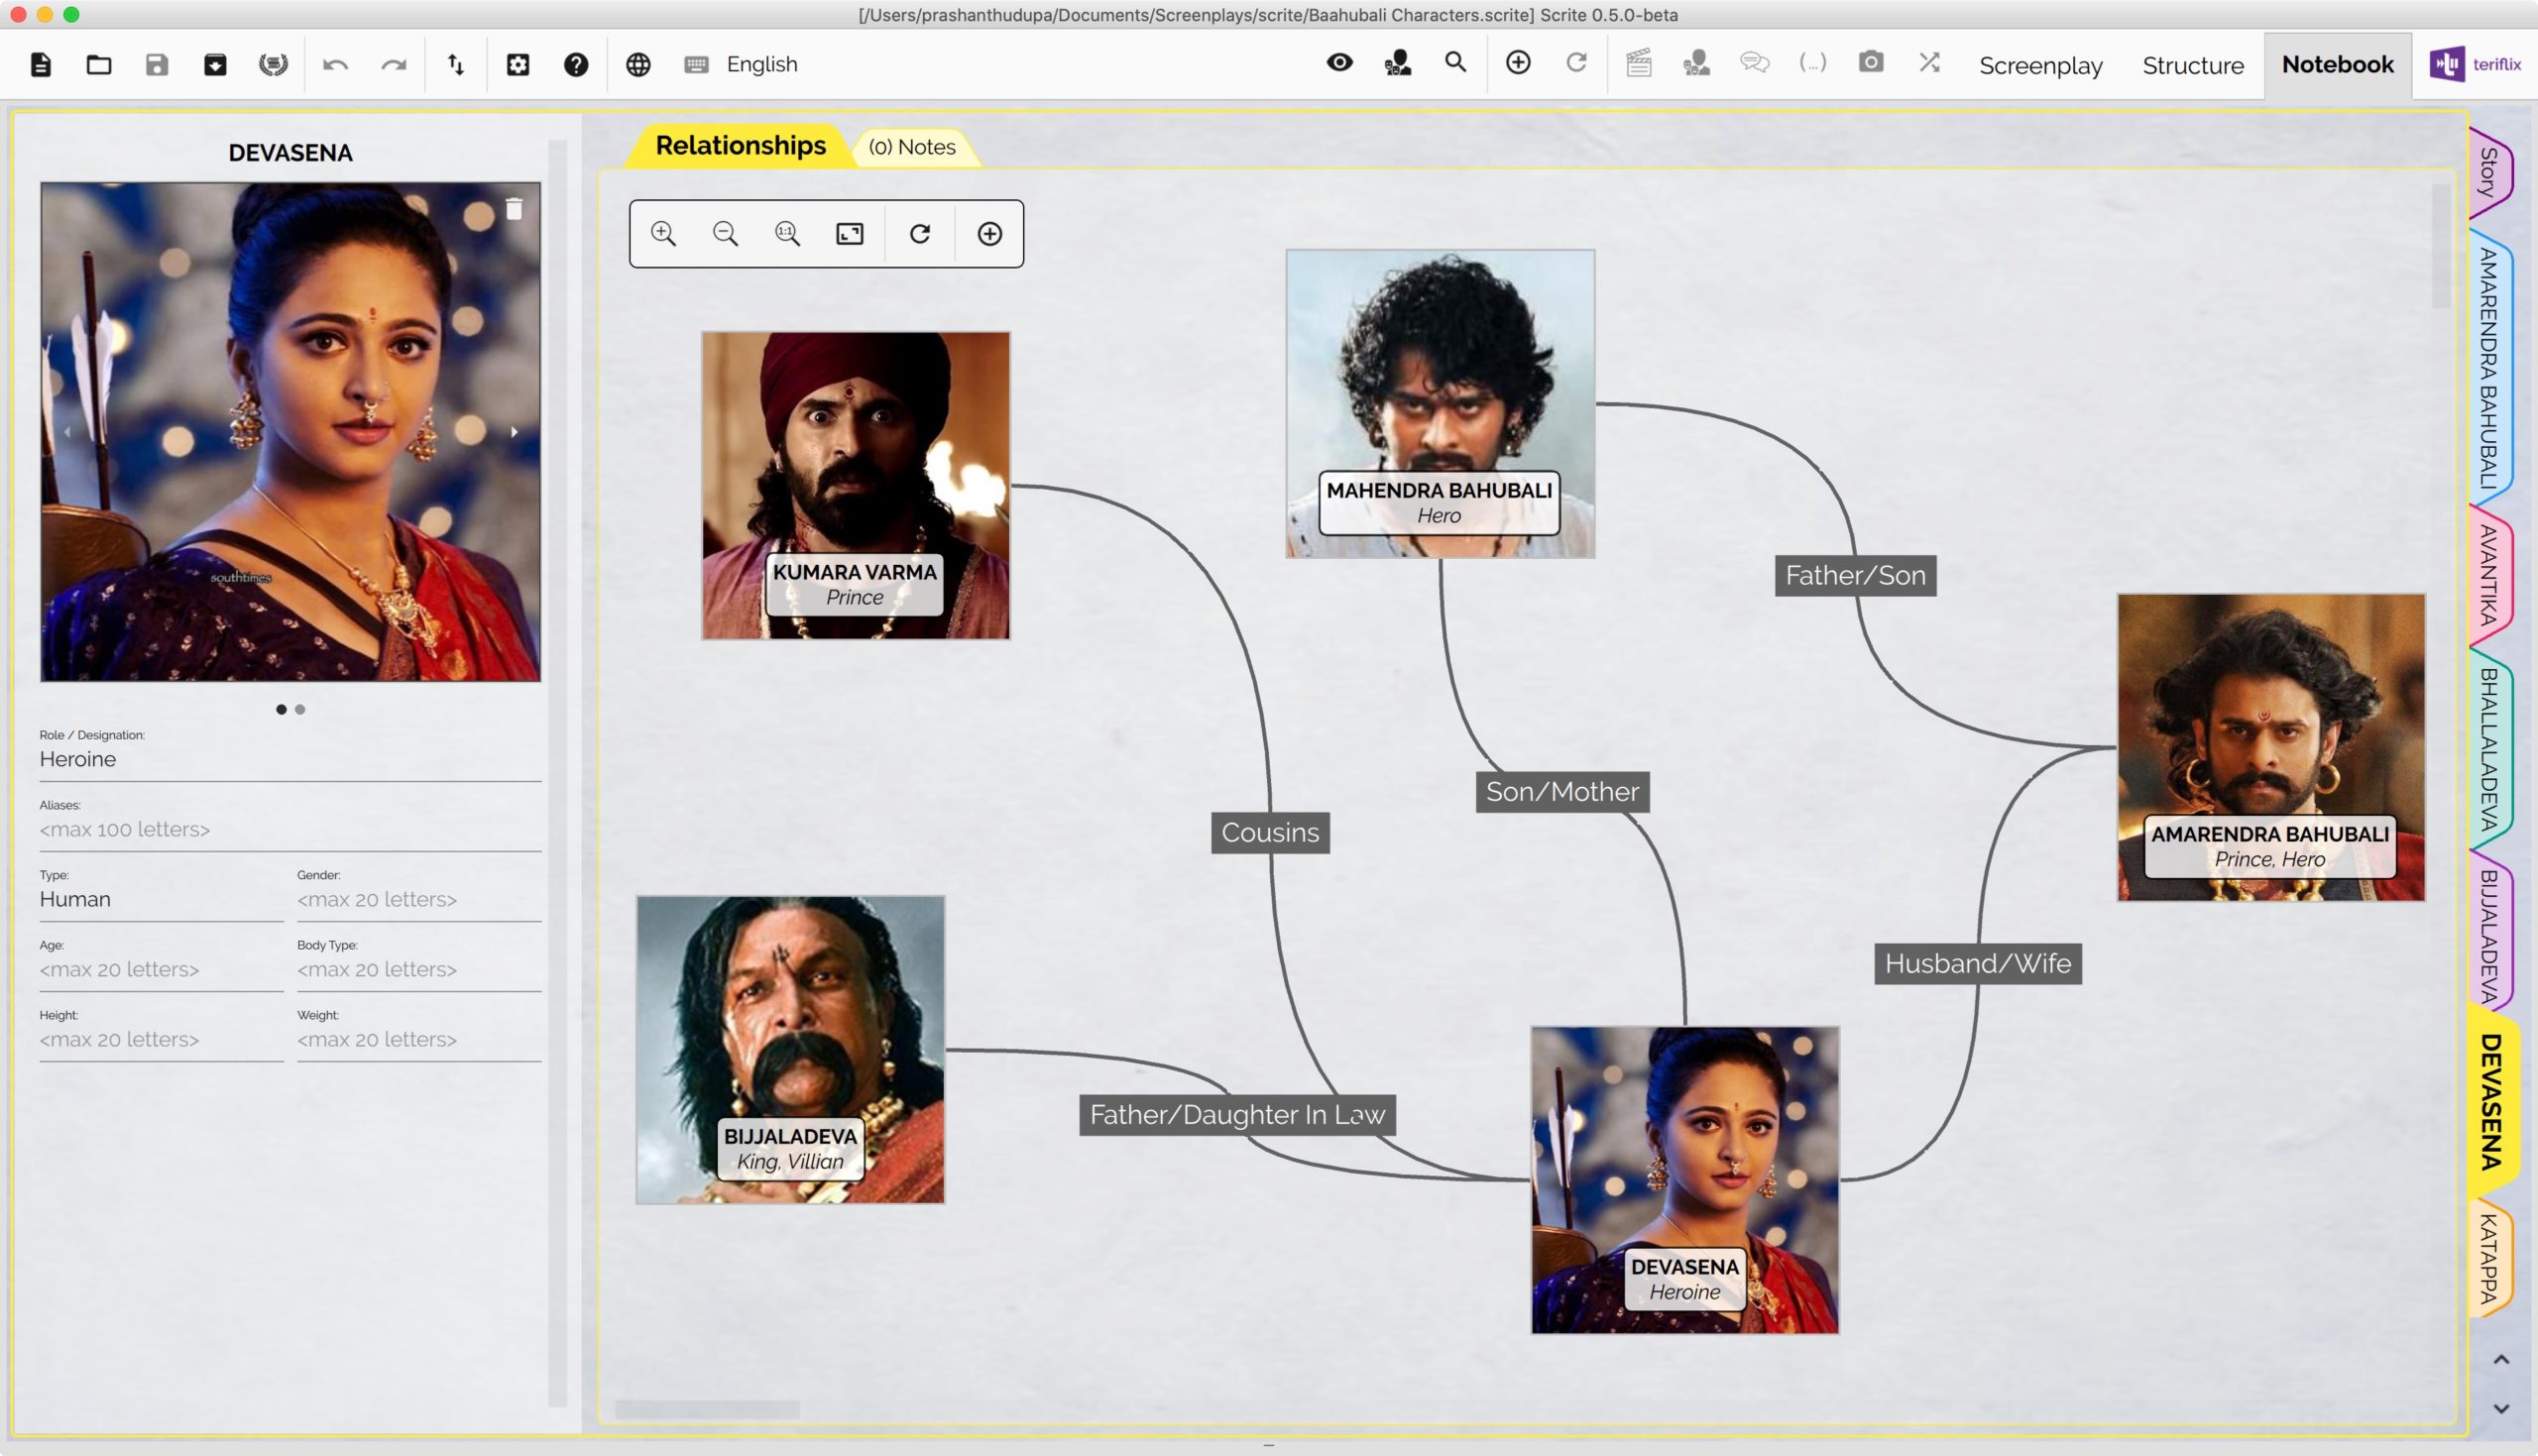
If we switch to DEVASENA’s tab for example, we see other relationships of DEVASENA.
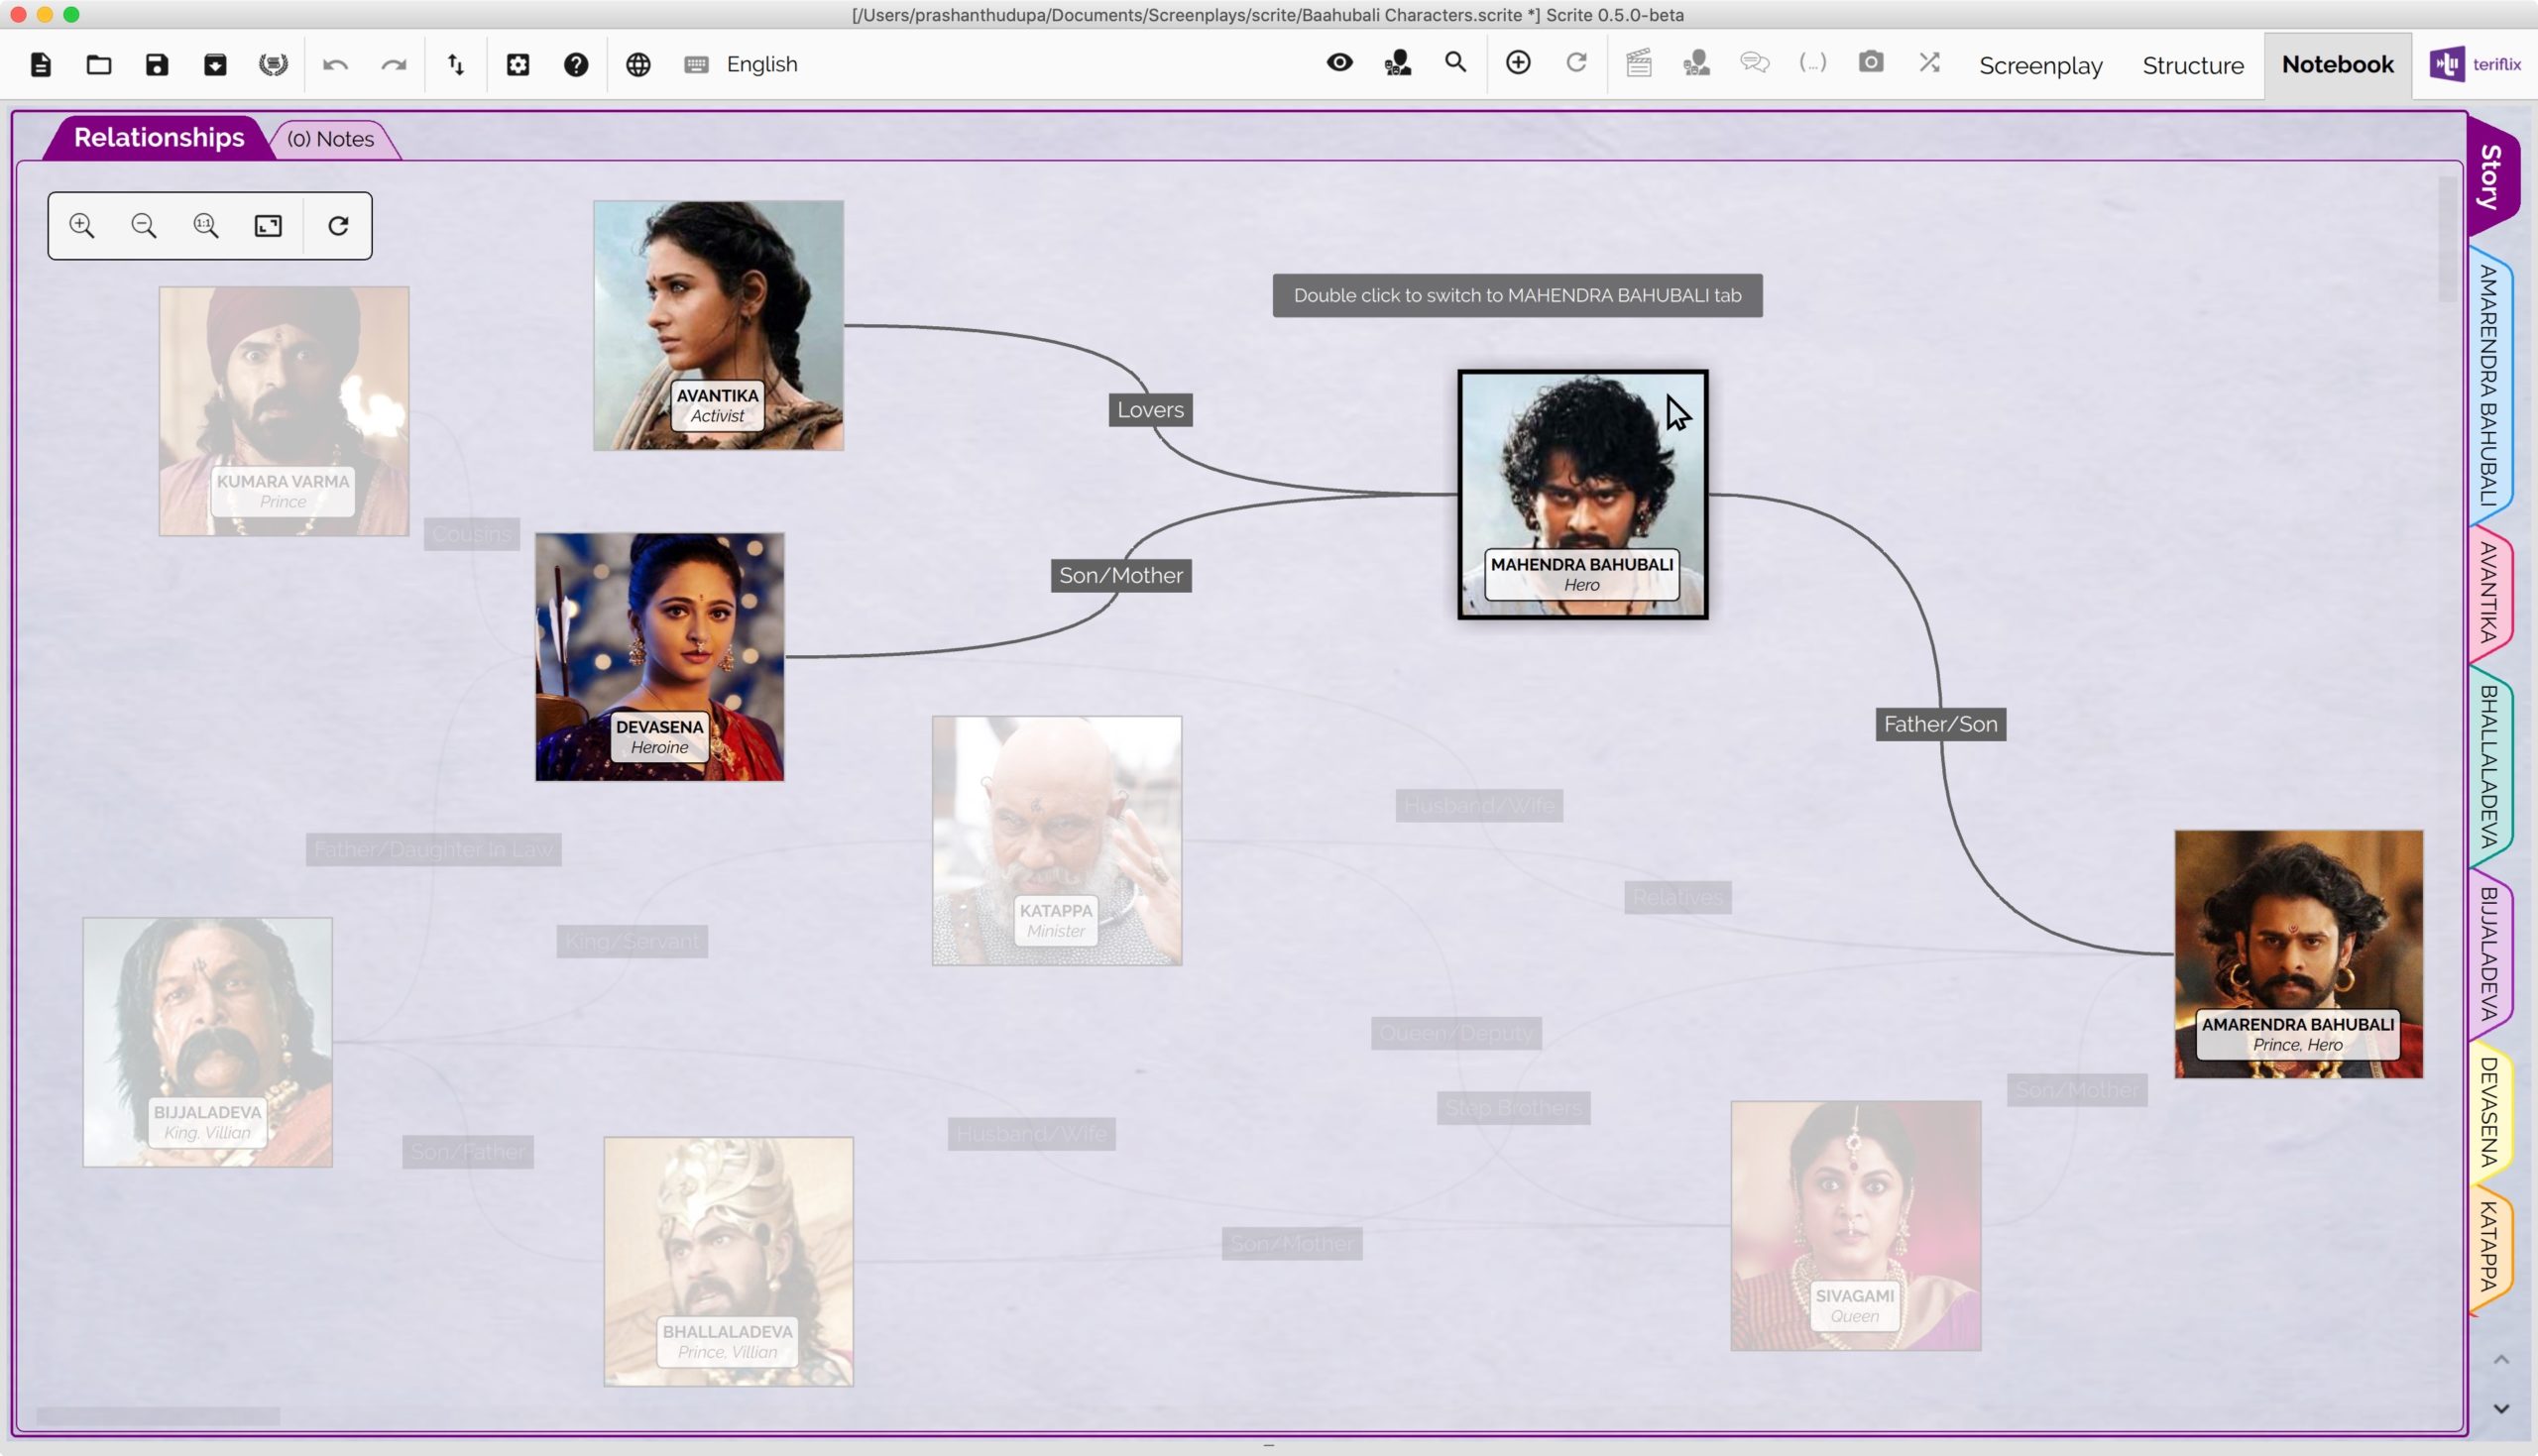
Like we mentioned before, the Story tab will contain a graph of all relationships in the screenplay.
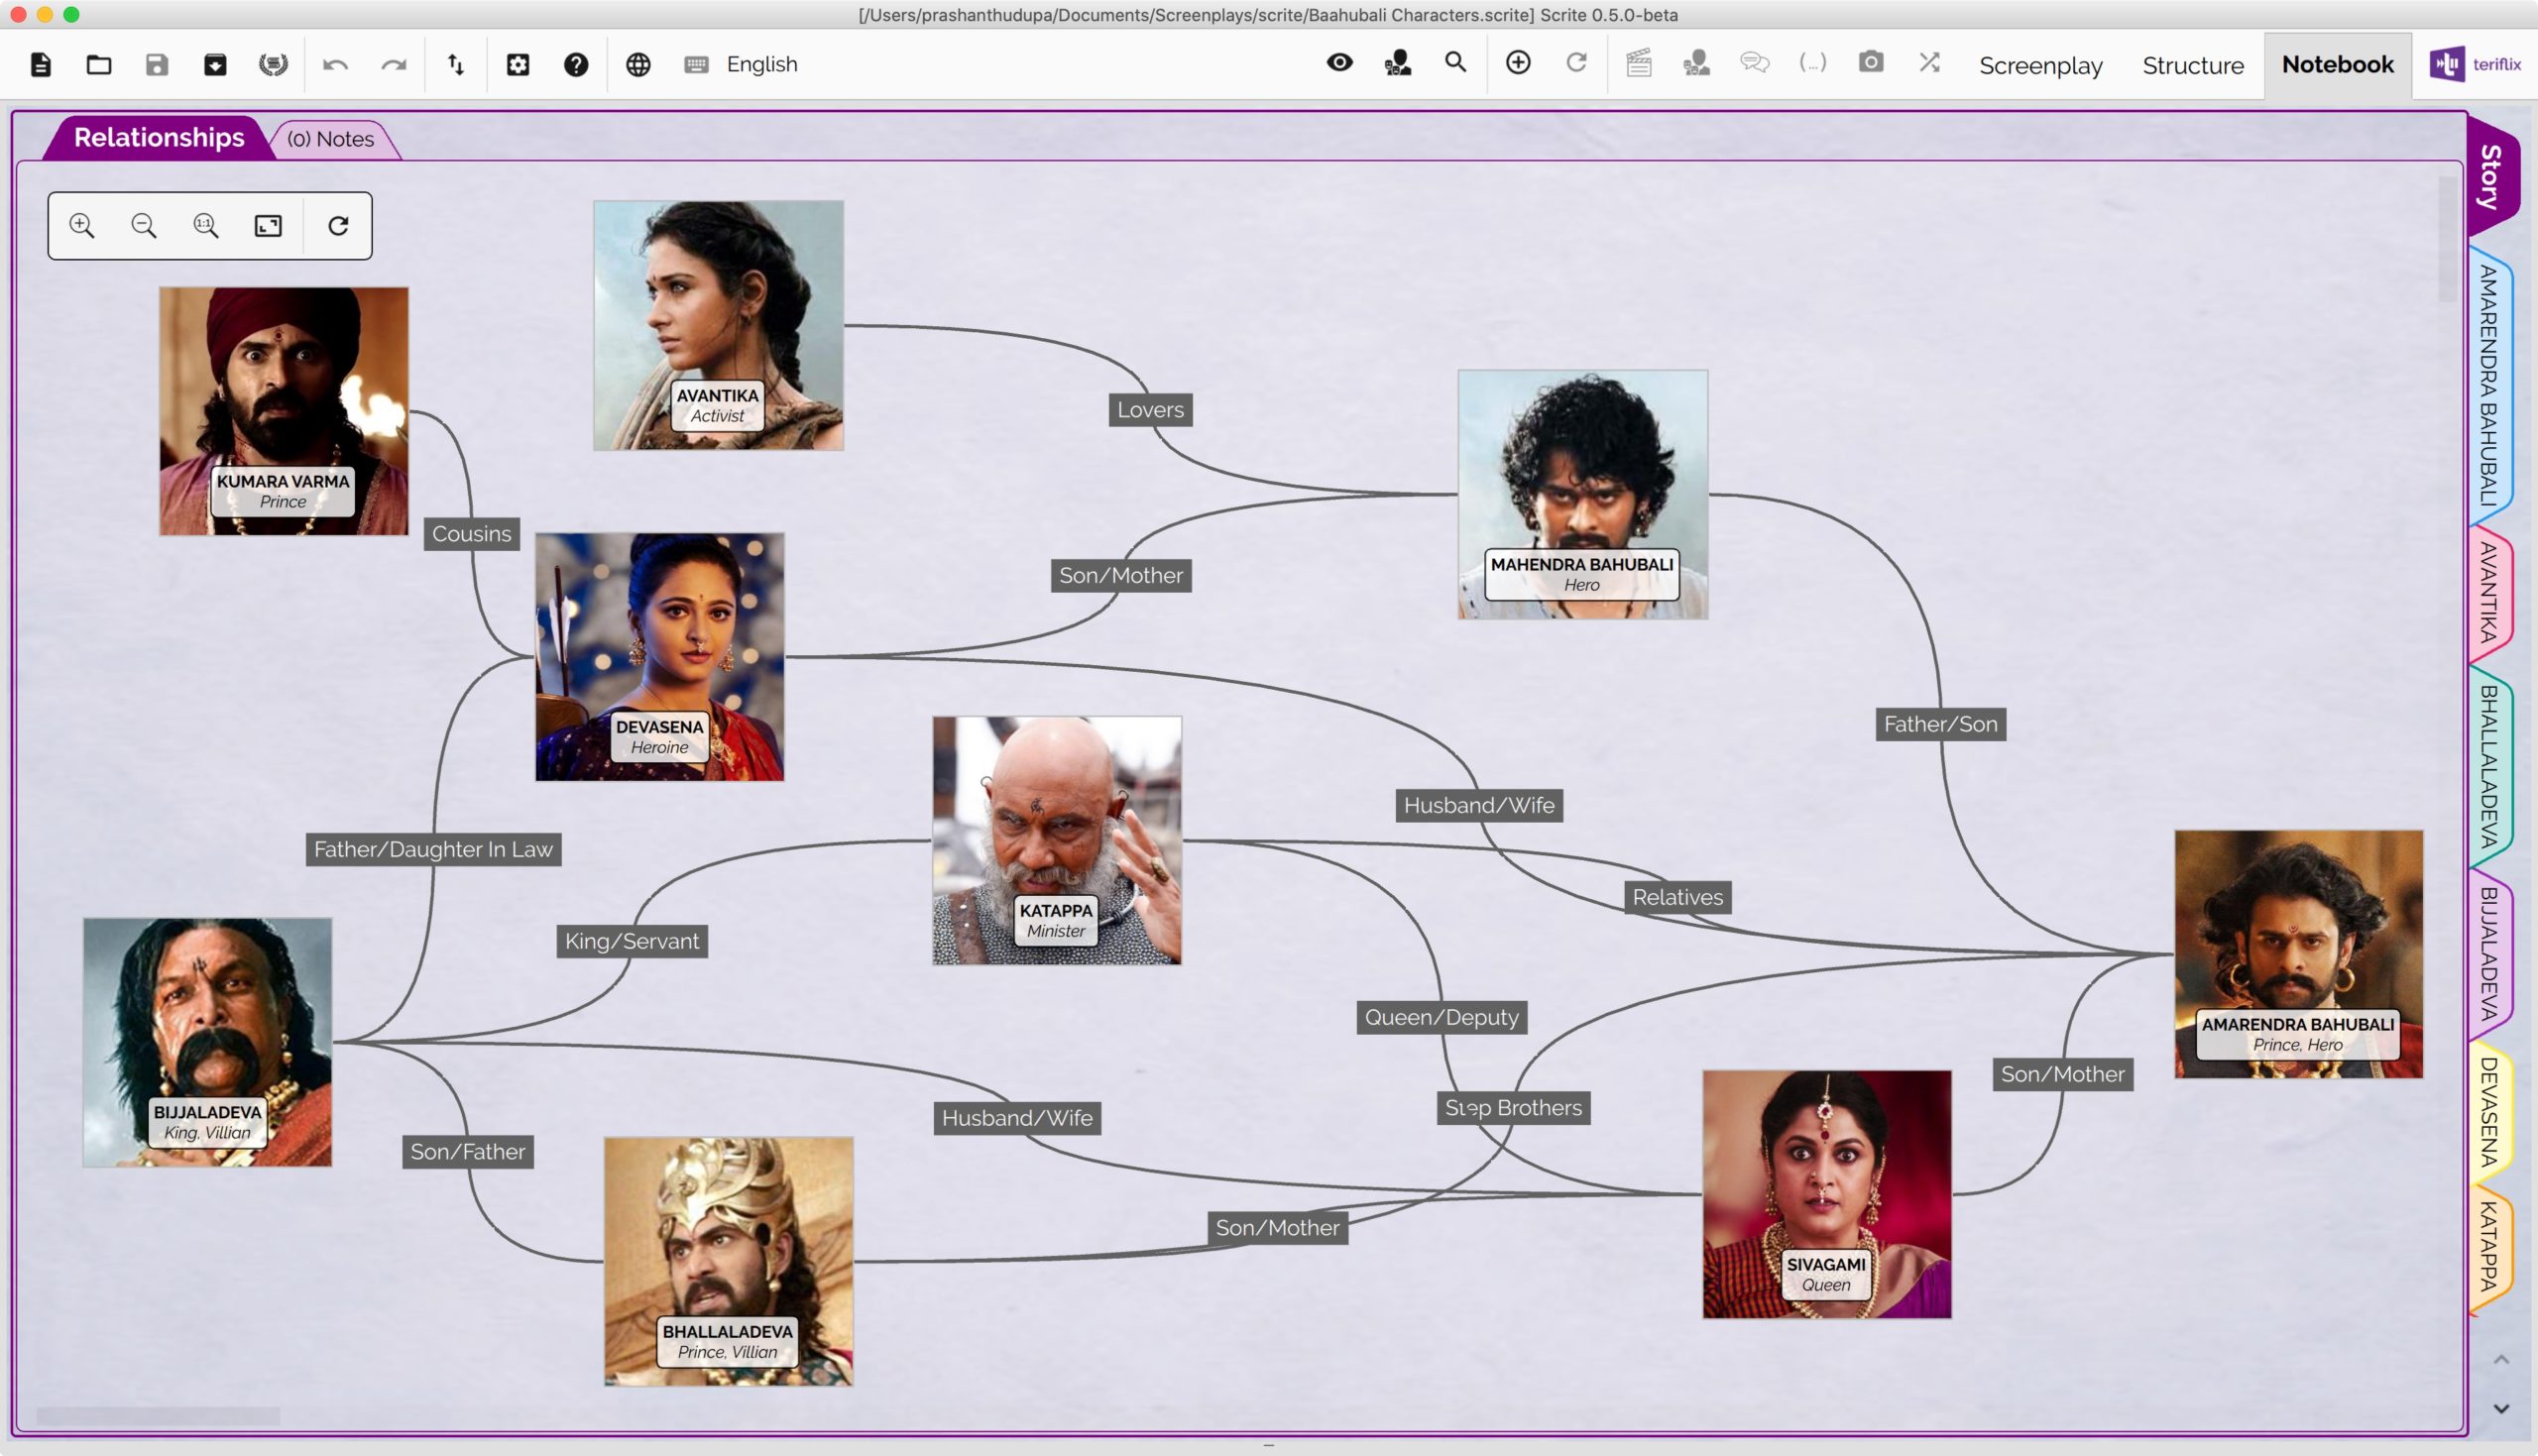
This graph, as you might have expected, looks complex. Because it captures all relationships in the screenplay. To make it easy to comprehend the graph, Scrite highlights direct relationships whenever any of the character is clicked on and selected.
While many of the features in Scrite (like screenplay editor, scene list etc) have reference implementations in other apps; we couldn’t find a feature like character relationship graph in any of the apps that we tried. We are making this one up, in the hope that it would be useful to writers. Let us know what you think.
Version 0.5.0 Beta is now out. Download / Upgrade and try out this new feature.